According to a study conducted by The Wharton School of Business, businesses can reduce the duration of their meetings by 24% by incorporating data visualization techniques. Hence it is clear. Having the right reporting tools to forge this wealth of information into clear, actionable insights is crucial.
These powerful assets allow businesses, large and small, to sift through the noise and hone in on what truly matters.
But here’s the great news: You don’t need to be a tech wizard to wield these tools successfully. The best reporting tools today are designed with user-friendliness in mind, offering intuitive interfaces alongside robust functionalities.
In the lines that follow, we will journey through the five best reporting tools that stand tall in 2023. These champions are here to not just simplify data interpretation but to revolutionize it, ushering in a new era of effortless yet dynamic reporting.
Quick List of 5 Reporting Tools
- Onethread: Seamlessly integrate and visualize data from various Google services in one platform.
- Tableau: A visually-rich tool that transforms raw data into insightful interactive dashboards.
- QuickBooks Online: It’s powerhouse for data visualization and business analytics.
- QlikView: A unique associative model that promotes data discovery and user-driven insights.
- Sisense: End-to-end BI platform allowing users to easily join, analyze, and visualize complex datasets.
Our reviewers evaluate software independently. Clicks may earn a commission, which supports testing. Learn how we stay transparent & our review methodology
Comparison Chart Of Reporting Tools
Here’s a comparison chart of the reporting tools based on unique features:
Tools | Visualization Capabilities | User Interface | Collaboration | Specialty Focus |
Basic graphs & charts | Simplified UI | Limited sharing | General reporting | |
 | Advanced interactive dashboards | User-friendly with drag-and-drop | Collaborative workspace | Broad BI & analytics |
 | Financial charts & reports | Intuitive for accounting tasks | Multiple user roles & permissions | Financial reporting & accounting |
 | Associative data visualization | Dynamic app-driven UI | Shared app development | Associative data exploration |
 | Drag-and-drop widget-based dashboards | Customizable, intuitive interface | Collaborative analytics & sharing | Complex data analytics & embedded BI |
What is Reporting Tools?
Reporting tools are software applications that help individuals and businesses gather data, process it, and present it in a structured format. These tools simplify complex data sets, making them understandable.
They turn raw data into visual charts, graphs, or reports. This helps in making informed decisions. Whether it’s for business analysis, finance, or sales trends, reporting tools are essential for clarity and insight. They offer a bridge between raw data and meaningful information.
Why Reporting Tools Is Important to Your Business?
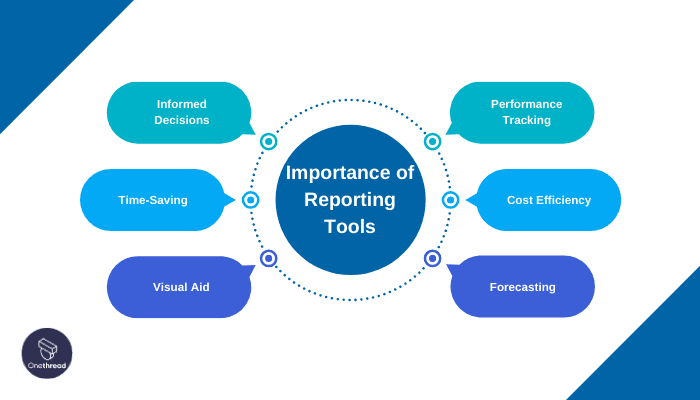
Understanding data is vital for any thriving business. Reporting tools play a crucial role in this understanding. Here’s why:
- Informed Decisions: They convert complex data into actionable insights, guiding your choices.
- Time-Saving: Automated reports mean less manual work, freeing up time for strategic tasks.
- Visual Aid: Data visualization makes patterns and trends clear, aiding in presentations and meetings.
- Performance Tracking: Monitor business health, from sales to customer feedback.
- Cost Efficiency: Spot wasteful expenses and optimize resource allocation.
- Forecasting: Predict future trends based on current data, helping with planning.
In short, reporting tools provide clarity, drive efficiency, and foster growth in businesses.
Key Features to Consider in Reporting Tools
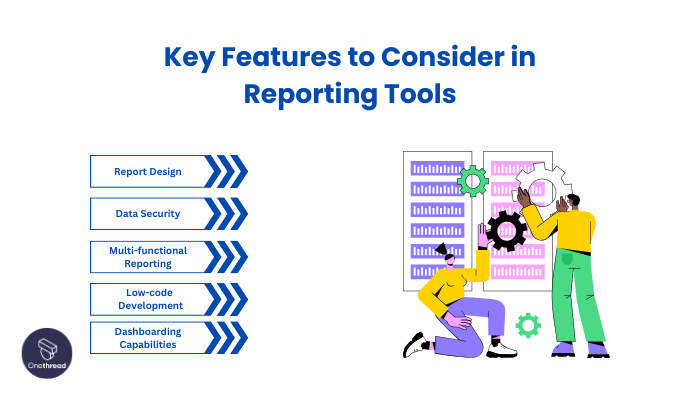
Choosing the right reporting tool is a decisive step in mastering your business data. Let’s delve deep into the primary features you should be on the lookout for, to ensure you make an informed choice.
Report Design
A versatile report design functionality allows users to create reports that are both informative and visually appealing. It offers templates for quick creation and the flexibility to design from scratch. The goal is to simplify complex data and present it in a manner easy to read and understand.
Data Security
In a world where data breaches are rampant, data security is non-negotiable. Your chosen tool should offer robust security features to protect sensitive data. This includes role-based access controls, encryption, and regular security updates to safeguard against unauthorized access and data leaks.
Multi-functional Reporting
Multi-functional reporting means the tool can handle various reporting tasks from financial analyses to marketing insights. It’s about having a tool that accommodates different data types and sources, presenting a holistic view of business operations. This feature saves time and offers a one-stop solution for all your reporting needs.
Low-code Development
Low-code development is about simplicity and efficiency. It allows users to create reports with minimal coding knowledge. This feature empowers a broader range of team members to use the tool effectively, fostering a collaborative work environment where insights are shared fluidly, without a steep learning curve.
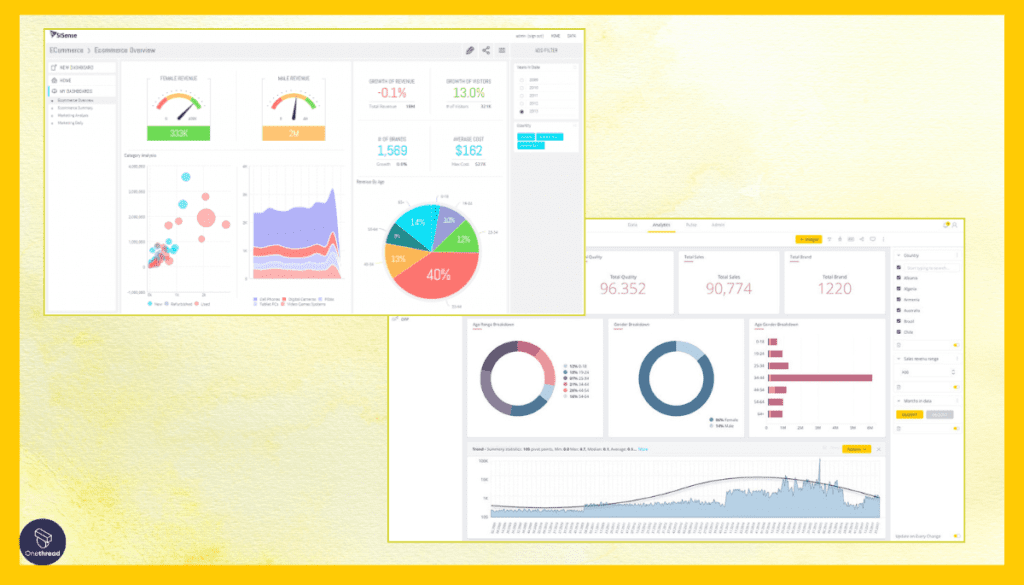
Dashboarding Capabilities
Dashboarding is your window to critical insights, offering a real-time snapshot of business performance. A good tool should allow the creation of interactive dashboards that highlight key metrics vividly. These dashboards should be customizable, enabling users to focus on the data points most relevant to them, thus facilitating quicker and smarter decision-making.
Top 5 Reporting Tools
Raw data is like unrefined gold—valuable but not yet in its most useful form. Reporting tools are the alchemists, turning this raw material into actionable insights.
Here’s a quick peek into the top five tools that are revolutionizing the way businesses understand and utilize their data in 2023. Dive in to discover which tool might be your key to unlocking the mysteries of your data.
#1. Onethread
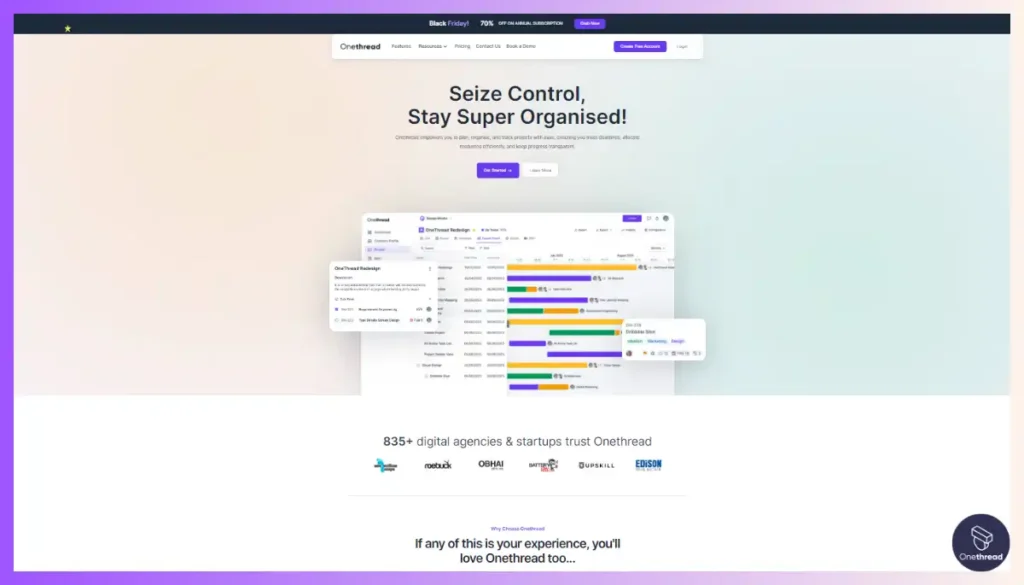
It’s a game-changer for businesses seeking clarity from data. At its core, Onethread offers direct API integrations. This means your data sources are seamlessly connected, ensuring a smooth data flow.
Visually, Onethread provides basic yet impactful graphs and charts. These visuals distill complex data sets into easy-to-digest insights. No frills, just the essence.
But where Onethread truly excels is in general reporting. It’s designed to serve businesses with clarity and precision. If you want a tool that strips away the noise and presents only the core message, Onethread is your go-to.
Overview and key features
Onethread stands out in the crowded marketplace of reporting tools. Its strength? A suite of features crafted for businesses aiming to turn data into action. Here’s a detailed look into what makes Onethread an excellent choice for data aficionados.
Report Design
With Onethread, report crafting is intuitive and efficient. Users can quickly choose from preset templates or customize their own. Its design approach prioritizes clarity, ensuring reports are both detailed and digestible. The end result? Reports that resonate and lead to informed decisions.
Data Security
Onethread doesn’t compromise on data protection. It comes equipped with state-of-the-art security measures. Features like role-based access and data encryption are standard. Your data’s safety is a top priority, ensuring unauthorized access and leaks are things of the past.
Multi-functional Reporting
Versatility is a hallmark of Onethread. It caters to diverse reporting needs, from financial reviews to operational insights. By integrating varied data sources and types, Onethread provides a comprehensive view, making it a one-stop solution for diverse reporting requirements.
Low-code Development
Onethread champions inclusivity. Its low-code platform enables even non-tech users to create detailed reports. The learning curve? Almost non-existent. Teams can collaborate and share insights seamlessly, without the hurdles of complex coding.
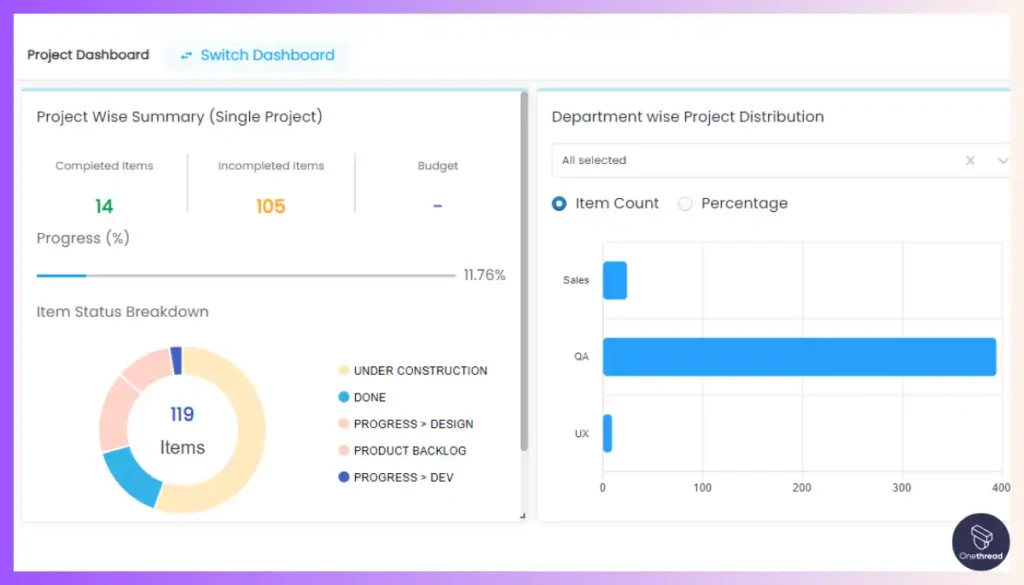
Dashboarding Capabilities
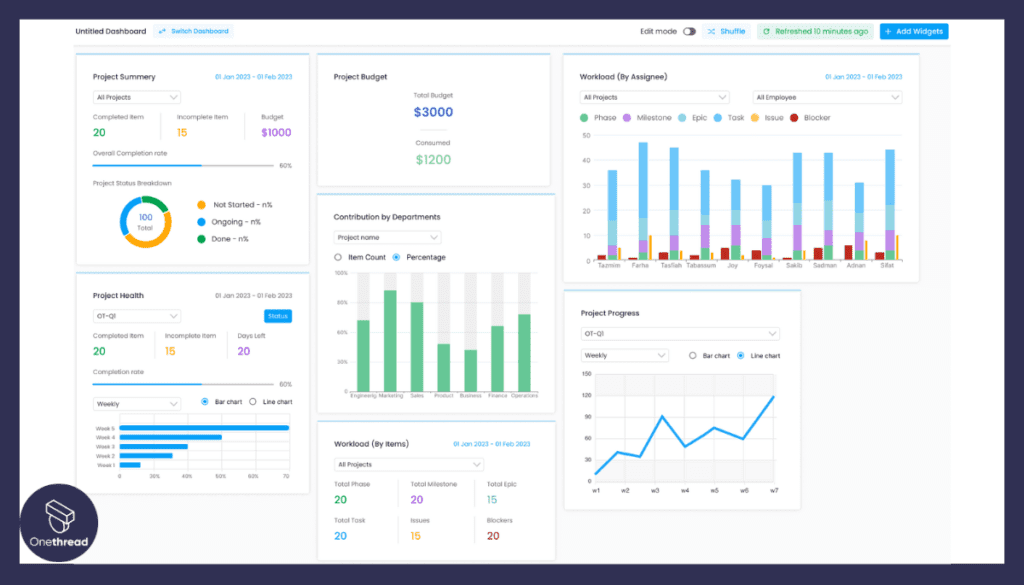
A glance at Onethread’s dashboard gives a snapshot of business health. Customizable and interactive, its dashboards distill key metrics for easy consumption. Whether tracking sales or monitoring operations, the dashboard offers real-time insights at your fingertips.
Pricing plans and options
Let’s unravel the offerings:
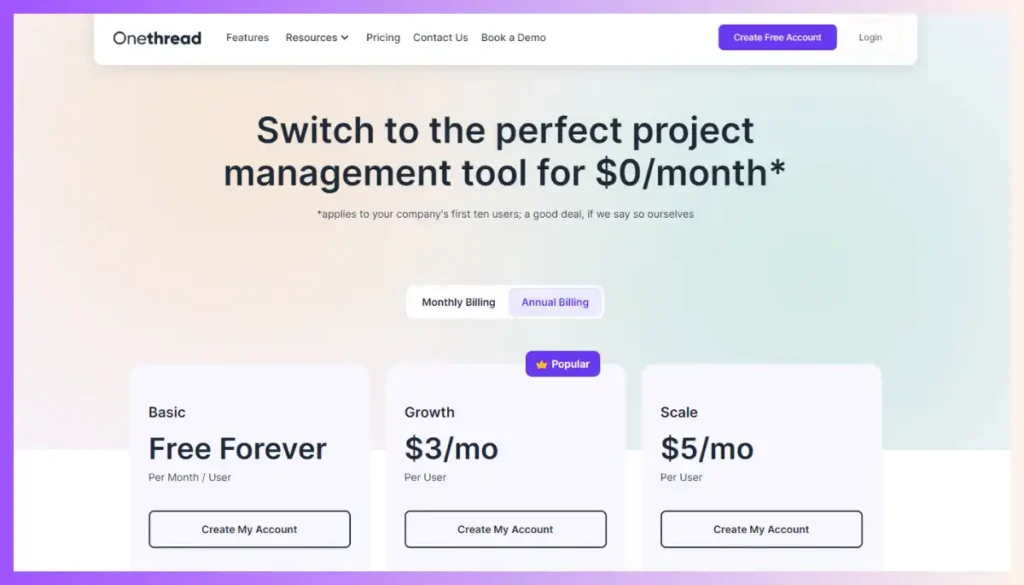
Free Plan
For beginners or small teams, this is a great starting point:
- Access: Basic functionalities.
- Reports: Limited number per month.
- Users: Single user access.
- Support: Community forum.
- Integration: Limited data sources.
Growth Plan – $3.6/month
Tailored for growing businesses with expanding needs:
- Access: Extended functionalities.
- Reports: Increased number per month.
- Users: Up to 10 users.
- Support: Priority email support.
- Integration: More data sources and API integrations.
- Customization: Basic report customization options.
Scale Plan – $6/month
The ultimate solution for established businesses aiming for the top:
- Access: All premium features unlocked.
- Reports: Unlimited monthly reports.
- Users: Unlimited user access.
- Support: 24/7 dedicated support.
- Integration: Full integration capabilities.
- Customization: Advanced report design and dashboarding.
Pros and cons
Pros:
- Even those new to reporting tools can navigate and utilize Onethread with ease.
- With options ranging from free to premium, businesses of all sizes can find a plan that fits their budget.
- Allows for broader team involvement and collaboration without needing advanced tech knowledge.
- Adapts to a variety of reporting needs, offering versatility in data presentation.
- Features like encryption and role-based access safeguard sensitive data.
Cons:
- Basic users might find the customization options restrictive.
- While functional, the dashboards may not offer the depth some advanced users seek.
#2. Tableau
Tableau is a powerful and user-friendly data visualization and business intelligence tool designed to help you understand and explore your data effortlessly.
With Tableau, you can create interactive and insightful visualizations, charts, and dashboards from your data. It’s ideal for businesses and individuals looking to make data-driven decisions.
Tableau simplifies data analysis, making complex information easy to understand. It’s a valuable tool for industries such as finance, healthcare, and marketing.
Whether you’re a data analyst or a business professional, Tableau is a credible and user-friendly choice to help you unlock the power of your data and make informed decisions.
Tableau – Overview
Product Information:
- Company Valuation: $15B
- Employee Numbers: 4181
Founding Team:
- Christian Chabot:
- Position: Co-founder, former CEO.
- Past Experience: [Specific past companies or roles from LinkedIn]
- Education: Stanford University, MBA.
- Chris Stolte:
- Position: Co-founder, Chief Development Officer.
- Past Experience: [Specific past companies or roles from LinkedIn]
- Education: Stanford University, Ph.D. in Computer Science.
- Pat Hanrahan:
- Position: Co-founder.
- Past Experience: Stanford University, Professor.
- Education: University of Wisconsin-Madison, Ph.D. in Computer Science.
Features
When it comes to visual data representation and business intelligence, Tableau has established itself as a frontrunner. Let’s see the features that work behind this reputation:
Drag-and-Drop Interface
One of Tableau’s crowning features is its user-friendly drag-and-drop interface. This makes complex data visualization a breeze. Users can easily manipulate data, create charts, and craft detailed reports without needing any coding expertise. This intuitive approach democratizes data analytics, allowing everyone to take part.
Real-time Data Collaboration
In an ever-evolving business environment, real-time data is pivotal. Tableau allows multiple users to collaborate on datasets in real-time. Teams can simultaneously analyze, annotate, and share insights, ensuring that everyone is on the same page and working with the most recent data.
Advanced Data Integration
Tableau integrates seamlessly with a vast array of data sources, be it SQL databases, cloud services, or web applications. This flexibility ensures users always have the relevant data at their fingertips. The deep integration capabilities mean you’re not toggling between platforms – it’s all in one place.
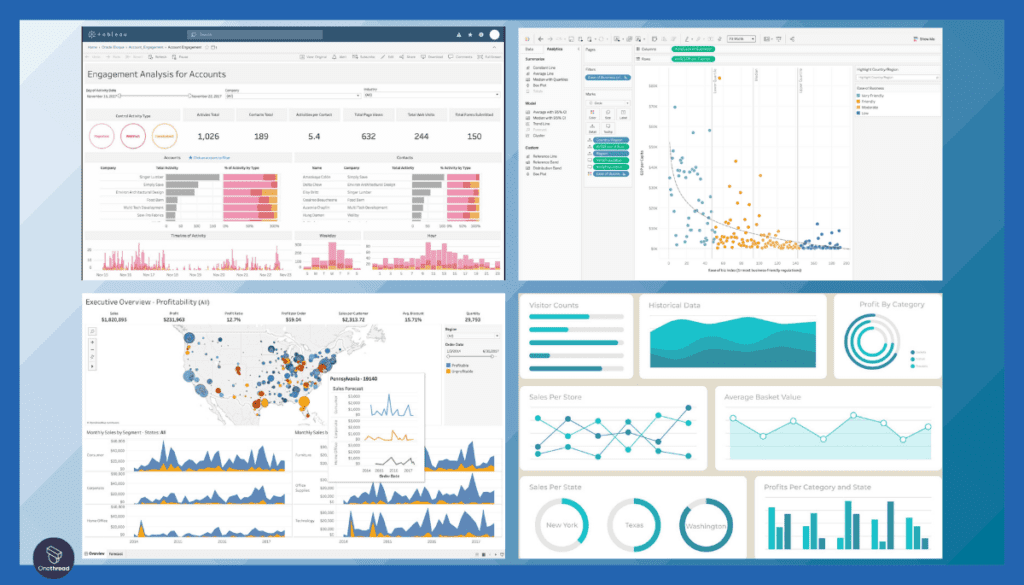
Interactive Dashboards
With Tableau, dashboards are not just static displays. They are interactive canvases where users can drill down, filter, and explore data layers. These dashboards can be shared and embedded, ensuring stakeholders can interact with the data, ask questions, and derive insights.
AI-Powered Insights
Harnessing the power of artificial intelligence, Tableau offers automated data recognition. The platform suggests visual representations, predicts trends, and identifies patterns, making data analysis more profound and actionable.
Pros & Cons of Tableau
Pros:
- Perfect for users of all expertise levels.
- Integrates with numerous data sources.
- Active user forums and extensive online resources.
- Dashboards and reports are accessible and interactive on mobile devices.
- Equally effective for small businesses and large enterprises.
Cons:
- Despite its intuitive design, mastering advanced features requires time.
- Higher-end features come with a steeper price tag.
- Can sometimes lag when handling extensive data.
Pricing Plans
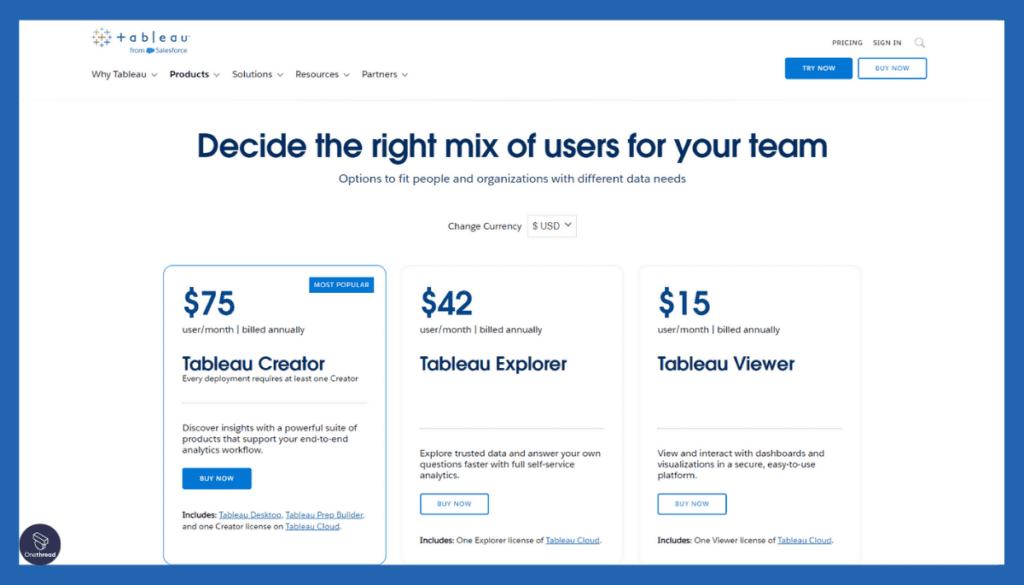
- Viewer: For end-users to interact with pre-built dashboards.
- Creator: For those creating and publishing dashboards, comes with advanced features.
- Server/Online: For organizations aiming to deploy at scale.
Customer Rating
- G2: 4.3/5
- Capterra: 4.5/5
Our Review
Tableau is celebrated for transforming data visualization in the business intelligence space. It provides powerful tools that allow intricate data analyses with visually stunning results.
Users often highlight its drag-and-drop interface and the ability to handle large datasets efficiently. On the downside, some note that its pricing model can be a barrier for smaller businesses.
Additionally, while its capabilities are expansive, the learning curve can be steep for those unfamiliar with data analytics. Tableau is an influential tool in the data visualization arena, but its complexity and cost might not be suitable for everyone.
#3. QuickBooks Online
QuickBooks Online is a user-friendly accounting software designed to simplify financial management for small businesses and self-employed individuals.
This software is widely trusted for its simplicity and effectiveness. It helps you organize your financial data, making tax time less stressful.
QuickBooks Online simplifies financial management, making it accessible even for those with no accounting background. It’s a valuable tool for small businesses, freelancers, and sole proprietors.
Product Information:
- Focus: Cloud-based accounting software for businesses.
- Parent Company: Intuit Inc.
- Employee Numbers (Intuit): <20
Founding Team of Intuit (the company behind QuickBooks Online):
- Scott Cook:
- Position: Co-founder.
- Education: Stanford University, MBA.
- Tom Proulx:
- Position: Co-founder.
- Education: Stanford University, B.S. in Computer Science.
Features
QuickBooks Online (QBO) emerges as a dominant force. It’s not just an accounting tool; it’s a comprehensive solution empowering businesses to manage finances effectively and gain vital insights.
Seamless Invoicing and Payment
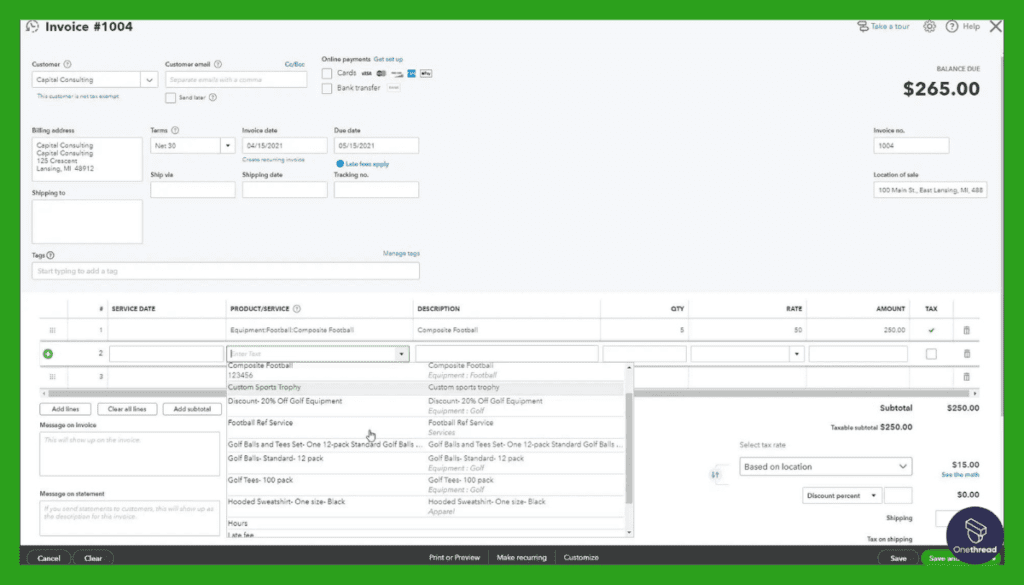
QBO’s invoicing feature is not just about creating bills. It’s an integrated solution that allows businesses to craft, customize, and track invoices. Automated reminders ensure timely payments, and with built-in payment processing, clients can settle dues directly through the invoice link.
Expense Tracking
Understanding where money flows is crucial. With QuickBooks Online, businesses can connect bank accounts and credit cards, ensuring all expenses are tracked automatically. This feature helps in categorizing transactions and understanding spending patterns, making budgeting a simpler task.
Cash Flow Management
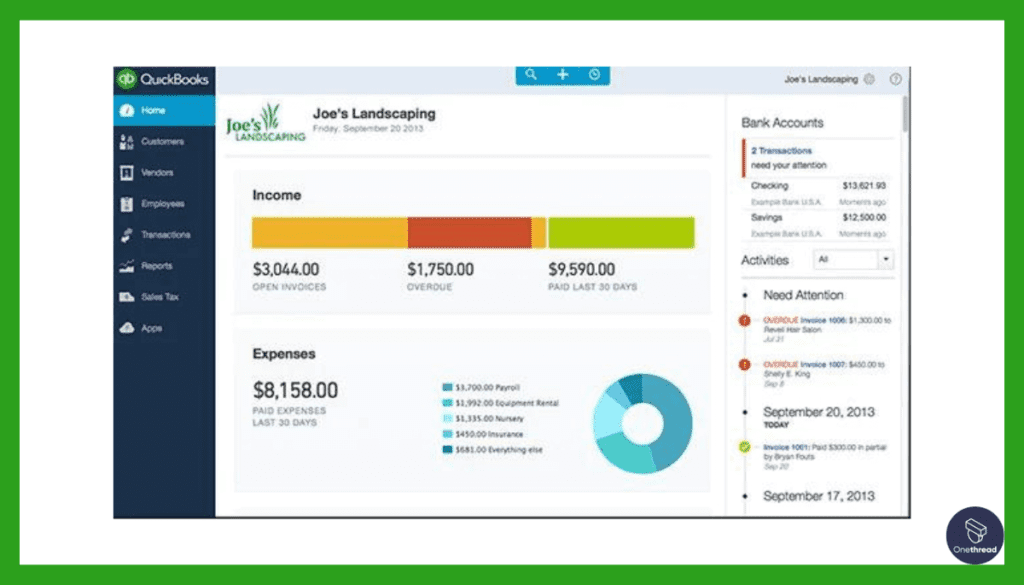
A business’s financial health is often determined by its cash flow. QBO’s dedicated dashboard offers real-time insights into income, expenses, and overall cash availability. Forecasting tools allow businesses to predict future cash positions, ensuring they’re never caught off guard.
Inventory Management
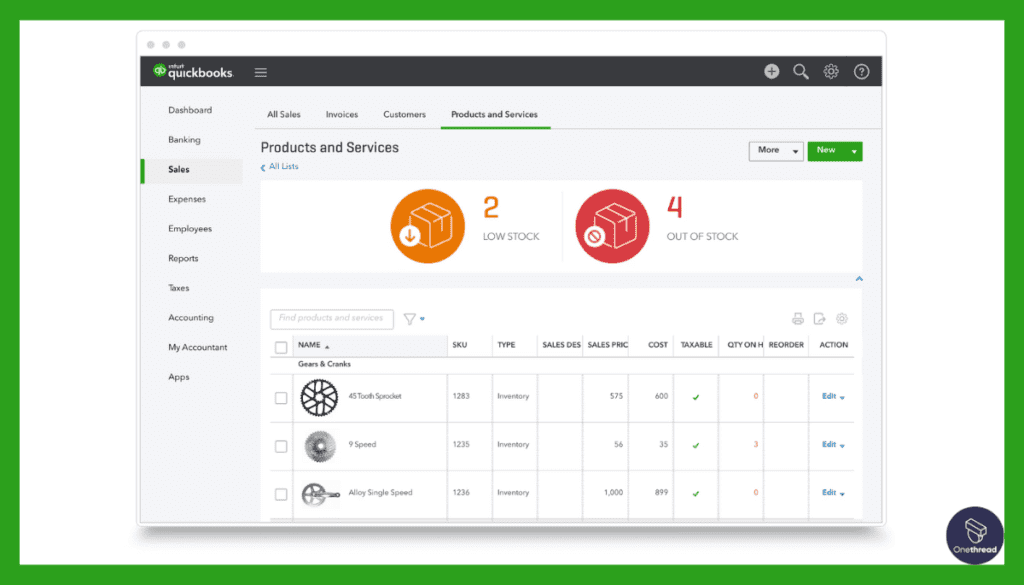
For businesses dealing with products, inventory management is paramount. QBO offers an intuitive system that tracks inventory levels, sales patterns, and reorder points. Alerts notify when stock levels dip, ensuring timely replenishment and uninterrupted business operations.
Tailored Reports
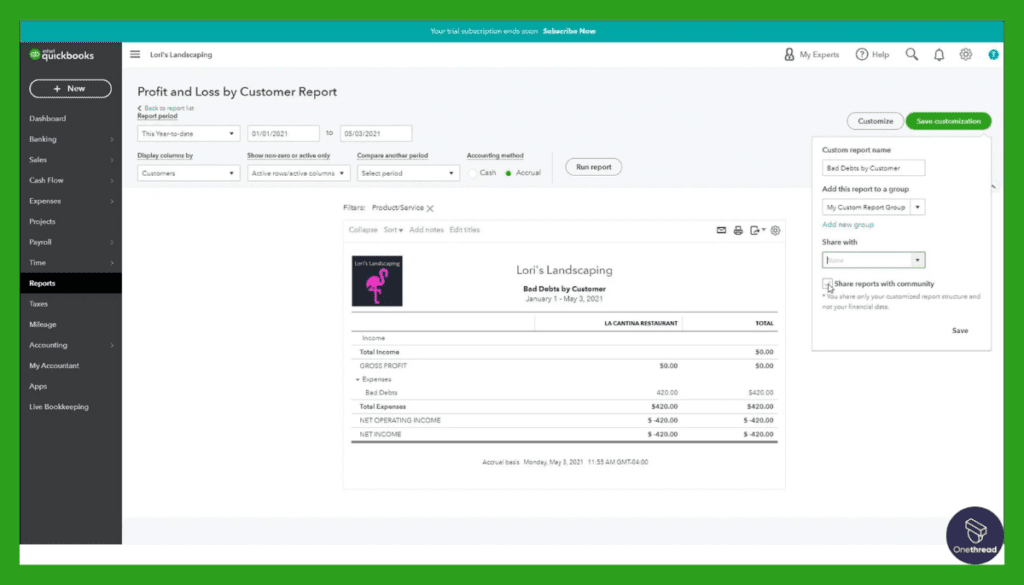
While QBO offers numerous preset reports, its real power lies in customization. Businesses can craft detailed financial reports, diving deep into specific areas. Profit and loss, balance sheet, or detailed transaction reports, the tool offers insights tailored to unique needs.
Pros & Cons of QuickBooks Online
Pros:
- Accessible anywhere, ensuring real-time data is always at hand.
- Seamlessly connects with numerous third-party apps.
- Daily backups mean data safety is a given.
- Intuitive and designed for users of all expertise levels.
- Helps in easy tax computation and filing.
Cons:
- Can be on the higher side for smaller businesses.
- Some features might not cater to businesses outside the U.S.
- Can sometimes experience lag during peak times.
Pricing Plans
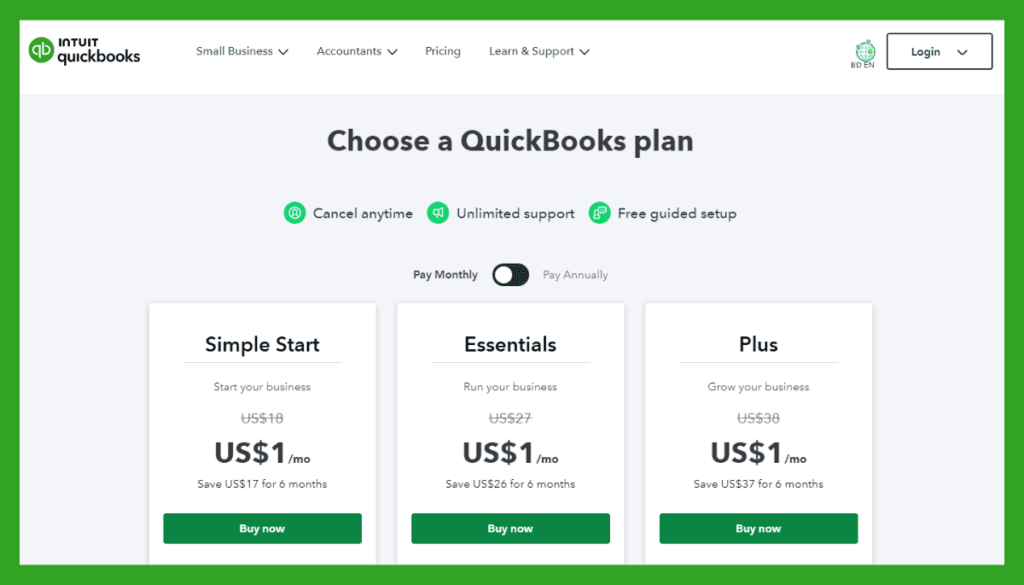
- Simple Start: For solopreneurs or new businesses.
- Essentials: Perfect for growing businesses with basic needs.
- Plus: Designed for established businesses looking for advanced features.
Customer Rating
- G2: 4.2/5
- Capterra: 4.3/5
Our Review
QuickBooks is a dominant player in the accounting software landscape. Renowned for its comprehensive features, it aids businesses in managing finances, invoicing, payroll, and more.
Its user-friendly design and cloud accessibility make it a favorite among many small to medium-sized businesses. However, critics often mention its relatively higher pricing and occasional software glitches.
Some users have also reported challenges with its customer service. In essence, while QuickBooks delivers robust accounting solutions and is praised for its functionalities, potential users should be mindful of its cost and occasional technical hitches.
#4. QlikView
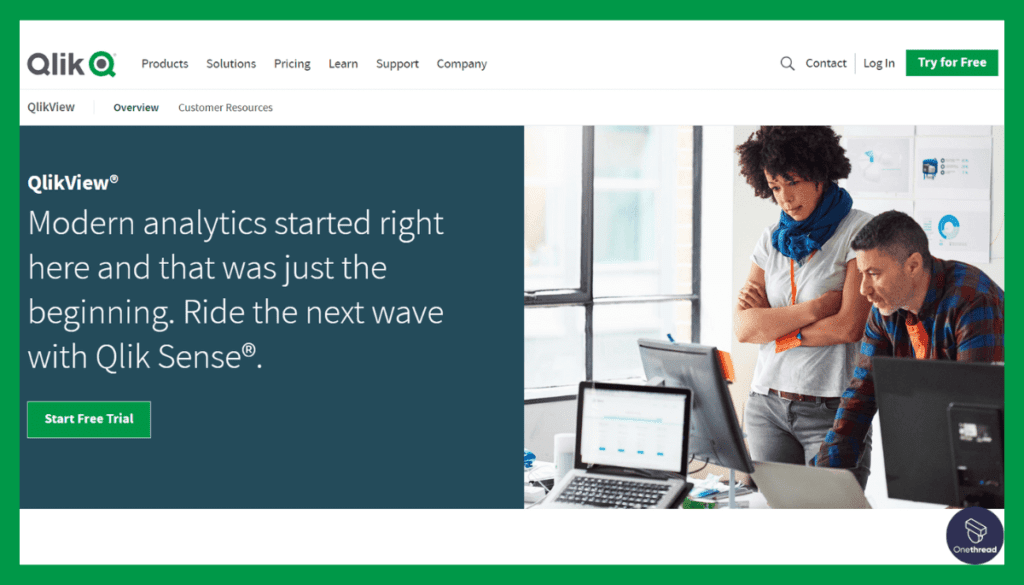
QlikView is a robust and user-friendly data visualization and business intelligence platform designed to help you explore and understand your data effectively.
With QlikView, you can create interactive and dynamic data dashboards and reports from various data sources. It’s ideal for businesses and individuals seeking insights from their data.
Whether you’re a data analyst or a business professional, QlikView is a credible and user-friendly choice to help you harness the power of your data and make informed decisions that drive success.
Product Information:
- Focus: Business intelligence and data visualization software.
- Parent Company: Qlik.
- Company Valuation (Qlik): $2.62B
- Employee Numbers (Qlik): 5000+
Founding Team of Qlik (the company behind QlikView):
- Björn Berg:
- Position: Co-founder.
- Staffan Gestrelius:
- Position: Co-founder.
Features
QlikView has carved a niche in the business intelligence arena. It’s not just another reporting tool; it’s a comprehensive analytics platform. With a commitment to helping businesses make data-driven decisions, QlikView stands tall with its dynamic features.
Associative Data Model
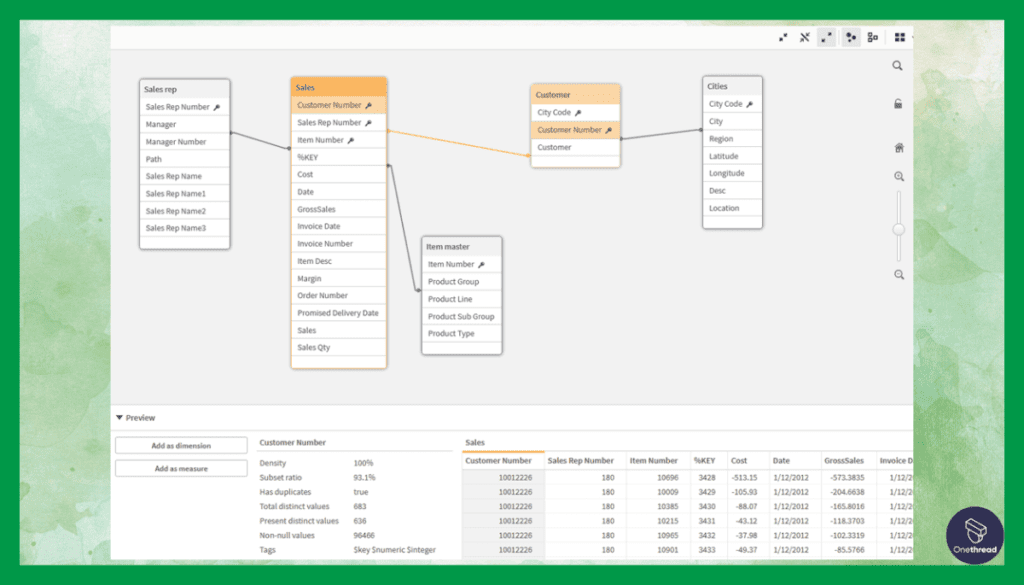
One of QlikView’s most celebrated features is its associative model. Unlike traditional BI tools that rely on pre-aggregated data and hierarchies, QlikView draws all relevant data and identifies hidden trends and patterns. This model enables users to make connections that would remain unnoticed in other tools.
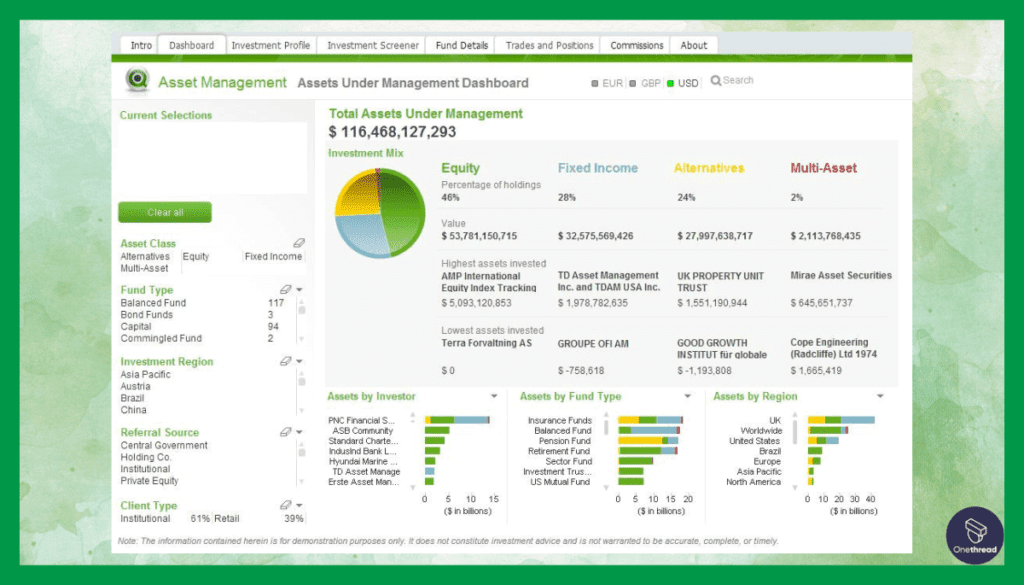
Interactive Dashboards
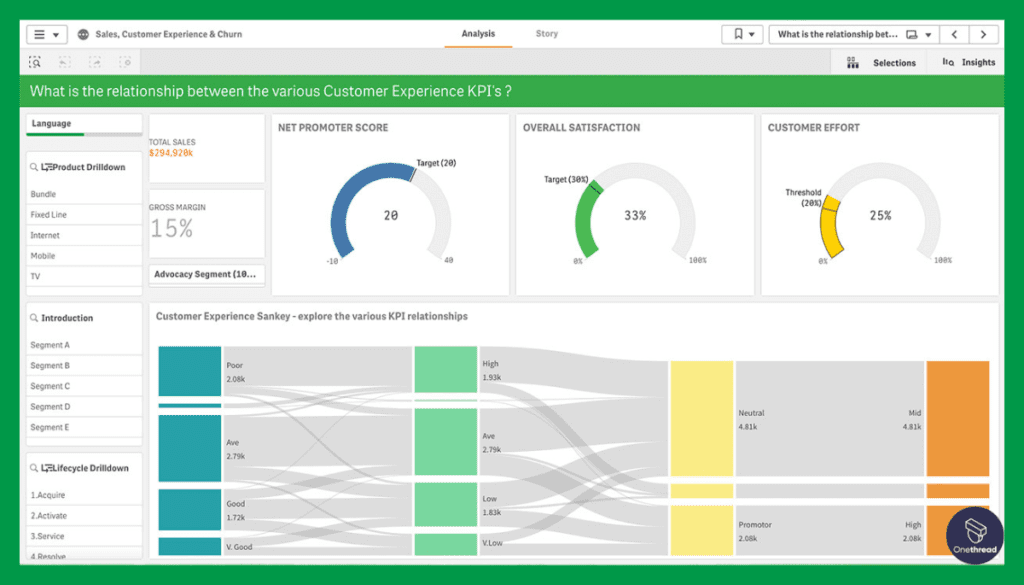
QlikView prides itself on offering dynamic dashboards. These dashboards are not just for visual appeal; they let users interact with data in real-time. This means businesses can delve deeper into the metrics, ask questions on-the-go, and receive instant answers, refining their decision-making process.
Fast In-Memory Data Processing
Speed is of the essence in today’s fast-paced business world. QlikView’s in-memory data processing ensures that reports and dashboards load rapidly. By storing data in the RAM, it facilitates quicker data retrieval, analysis, and visualization, streamlining the analytics process.
Personal Report Generation
Every business, or even department within a business, has unique reporting needs. Recognizing this, QlikView offers tools for personal report generation. Users can craft their reports, define parameters, and visualize data in ways most meaningful to them.
Direct and Indirect Searches
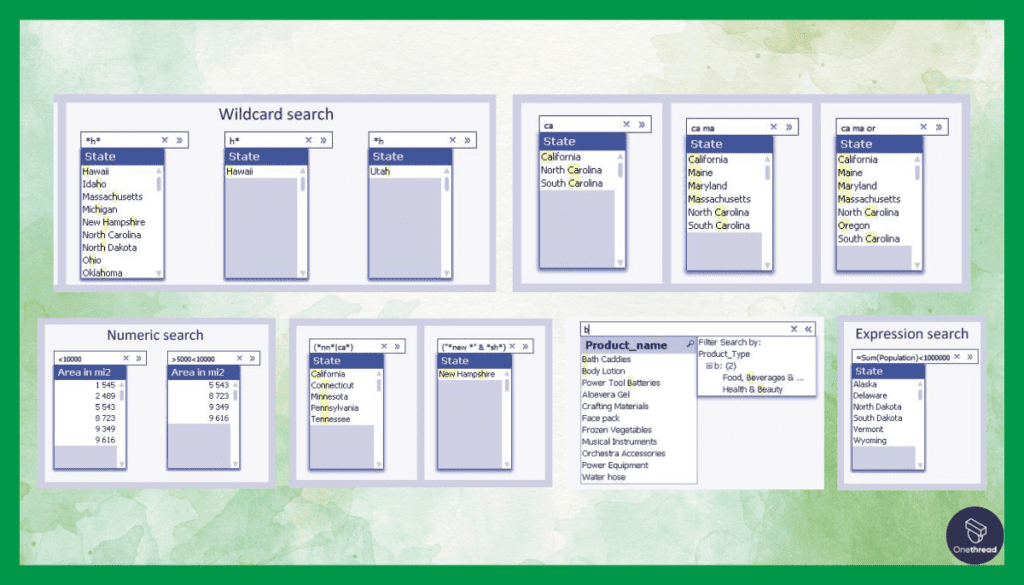
While direct searches are common in most tools, QlikView offers the advantage of indirect searches. Users can start with vague queries and let the platform guide them to more specific data points, ensuring no critical insight is ever missed.
Pros & Cons of QlikView
Pros:
- Easily adapts to varied business needs and data formats.
- Designed for ease-of-use, regardless of user expertise.
- Allows for shared insights and team-based analytics.
- Tailor-made reports and dashboards align with business objectives.
- Ensures data remains confidential and protected.
Cons:
- Mastery requires time and training.
- Licensing and deployment can be expensive for smaller businesses.
- Can be demanding on system resources.
Pricing Plans
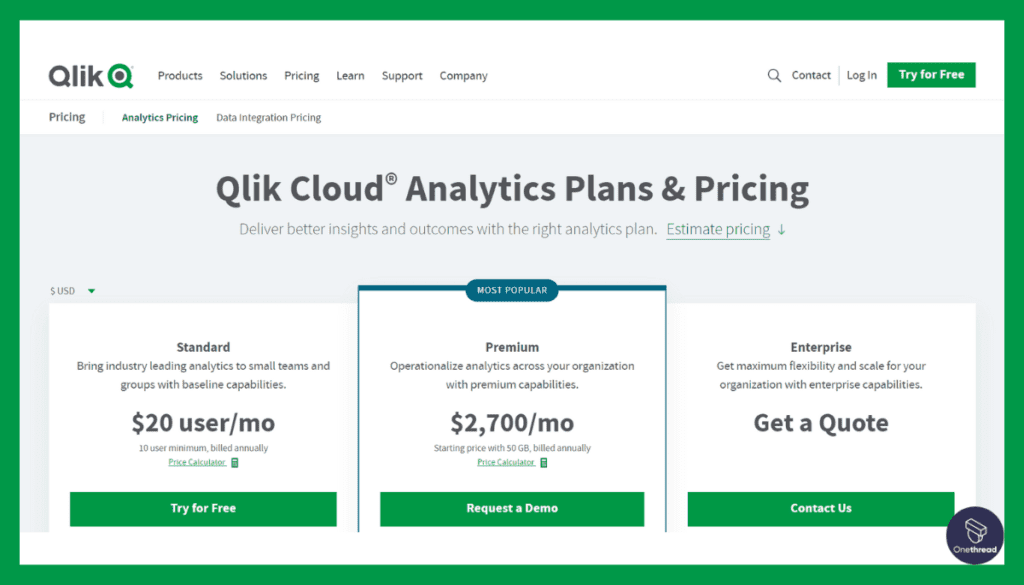
QlikView adopts a licensing model. There’s:
- Personal Edition: A free but limited capability version.
- Enterprise Pricing: This varies based on requirements and is best checked directly with the vendor.
Customer Rating
- G2: 4.1/5
- Capterra: 4.4/5 (aggregated from user feedback)
Our Review
QlikView, a noteworthy name in the business intelligence domain, is admired for its associative data modeling and interactive dashboard capabilities.
It offers dynamic views of data, allowing users to uncover hidden trends and patterns. However, some users have indicated that its scripting language can be complex for novices.
Additionally, when compared to newer visualization tools, its interface might seem less intuitive. In a nutshell, while QlikView excels in offering deep insights and flexible data interaction, beginners might face a learning curve and may find the interface less modern than some competitors.
#5. Sisense
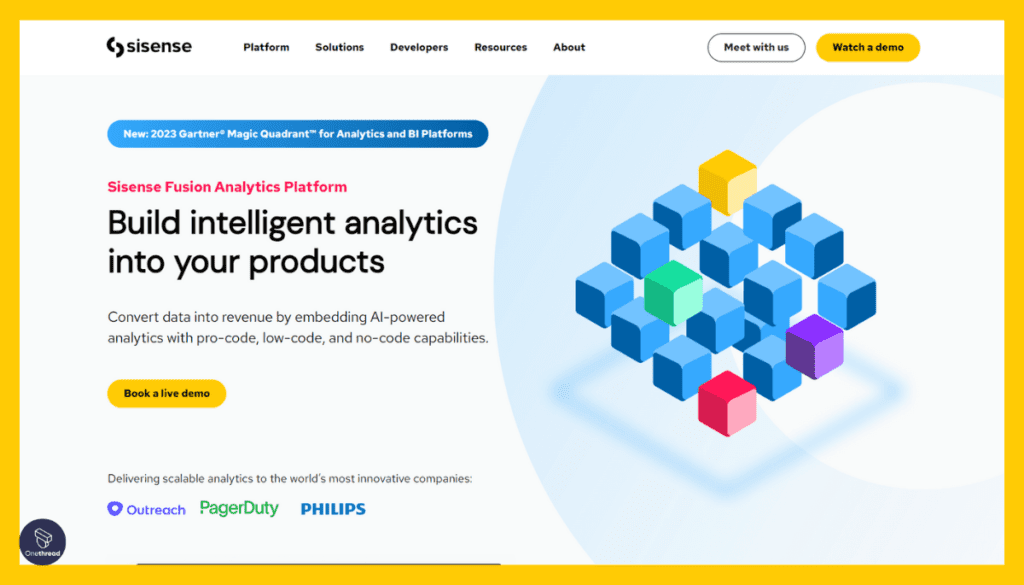
Sisense, a pioneering force in the realm of business intelligence and analytics, has redefined the way organizations harness data to drive informed decisions.
With a mission to make complex data accessible and actionable, Sisense provides a powerful platform that empowers users to explore, analyze, and visualize their data effortlessly. From startups to global enterprises, Sisense enables a wide spectrum of businesses to transform raw data into valuable insights.
Its user-friendly interface, robust features, and commitment to innovation have earned it a reputation as a trusted partner in the ever-evolving landscape of data analytics.
Sisense – Overview
Product Information:
- Focus: End-to-end business intelligence and data analytics platform.
- Company Valuation:$1B
- Employee Numbers:850
Founding Team:
- Amir Orad:
- Position: CEO (Note: Not a founder but a significant figure in the company’s growth).
- Elad Israeli:
- Position: Co-founder.
- Eldad Farkash:
- Position: Co-founder.
Features
This reporting tool isn’t just about showcasing numbers; it’s about turning those numbers into actionable insights. By merging simplicity with power, Sisense has established itself as a frontline player in the business intelligence world.
End-to-End BI Platform
Sisense’s prowess isn’t limited to just one phase of business intelligence. From data integration to visualization, it offers a complete solution. Businesses can gather data from multiple sources, process it, and then present it in intuitive dashboards, all within a unified environment.
Drag-and-Drop Interface
Intuitive design is at the heart of Sisense. The tool’s drag-and-drop interface ensures that creating reports and dashboards becomes a breeze. This user-friendly approach means even those without technical expertise can extract the insights they need without relying on IT support.
In-Chip Technology
Under the hood, Sisense operates with its unique In-Chip technology. This approach maximizes the hardware’s capabilities, ensuring faster data processing. As a result, even massive datasets can be analyzed quickly, providing real-time insights without lags.
Embedded Analytics
Data insights are more valuable when integrated into daily operations. Recognizing this, Sisense offers embedded analytics. This means businesses can incorporate BI dashboards and reports directly into their apps, systems, or websites, ensuring data-driven decisions at every step.
Customizable and Scalable
Every business has its nuances. Sisense understands this and offers deep customization options. Whether it’s the appearance of a dashboard or the processing of a specific data type, Sisense adapts. Plus, as businesses grow, Sisense scales alongside to meet evolving needs.
Pros & Cons of Sisense
Pros:
- From data integration to visualization, all in one place.
- Tailored for all, from tech novices to experts.
- Incorporates machine learning for smarter insights.
- Syncs seamlessly with a myriad of external tools.
- Quick responses and helpful resources.
Cons:
- Might be a significant investment for small businesses.
- With extensive features comes a learning curve.
- Some users report intermittent issues.
Pricing Plans
Sisense adopts a customized pricing model. Plans include:
- Basic: For startups and smaller enterprises.
- Pro: Catering to medium businesses with advanced needs.
- Enterprise: Tailored for large corporations with diverse requirements.
Customer Rating
- G2: 4.3/5
- Capterra: 4.5/5
Our Review
Sisense emerges as a force in the business intelligence world, especially for its end-to-end data analytics capabilities. Its drag-and-drop interface and the ability to merge data from multiple sources stand out to many users.
The tool’s embedded analytics and customizable dashboards are often hailed as top features. Conversely, some users have pointed out that more complex queries might demand a steeper learning curve.
Additionally, its pricing, being on the higher side, might deter smaller entities from adopting it. Summing it up, while Sisense is power-packed and versatile for intricate data analyses, newcomers and smaller businesses might need to assess its learning demands and cost implications.
Getting the Most Out of Reporting Tool
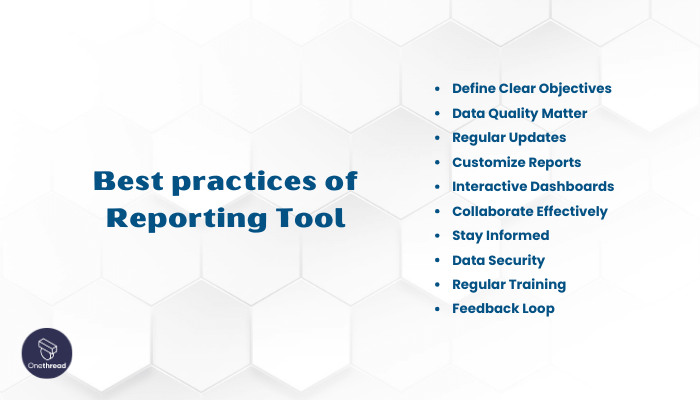
Your reporting tool is a powerful ally in making informed decisions. To harness its full potential, consider these best practices:
- Define Clear Objectives: Know what insights you seek from your reports.
- Data Quality Matters: Ensure your data is accurate and up-to-date.
- Regular Updates: Schedule automated report generation to stay current.
- Customize Reports: Tailor reports to your audience’s needs for maximum impact.
- Interactive Dashboards: Utilize interactive features for real-time exploration.
- Collaborate Effectively: Share reports and insights with relevant team members.
- Stay Informed: Keep up with tool updates and industry best practices.
- Data Security: Protect sensitive information with robust security measures.
- Regular Training: Invest in training to make the most of advanced features.
- Feedback Loop: Encourage users to provide input for tool improvement.
With these best practices, your reporting tool becomes a strategic asset, transforming data into actionable insights.
Final Thoughts
Reporting tools are the key to unlocking the full potential of your data. They empower businesses with the ability to transform raw information into actionable insights, aiding in informed decision-making.
By selecting the right tool, adhering to best practices, and harnessing its features effectively, organizations can gain a competitive edge and navigate the complex landscape of the modern business world with confidence.
FAQs
Are there free reporting tools available?
Yes, some reporting tools offer free or limited versions with basic features. These can be suitable for small businesses or individuals with basic reporting needs.
What is the difference between reporting and business intelligence tools?
Reporting tools primarily focus on presenting data in a structured format, while business intelligence tools encompass a broader range of data analysis and decision support capabilities.
How can I ensure data security when using reporting tools?
Choose a reporting tool that offers robust data security features, including encryption, role-based access control, and regular security updates.
Do reporting tools offer real-time data analysis?
Some reporting tools provide real-time data analysis, allowing users to access and analyze the most current data, while others may have a slight delay depending on data processing capabilities.