Did you know that 90% of the world’s data was created in the last two years? Yet, only a fraction gets analyzed. Imagine the treasure trove of insights lying in that unused data. That’s where Business Intelligence tools come in.
These tools turn raw data into meaningful insights. They help you make informed decisions. Because data drives success, it’s like a GPS for your business. You find out where you are. Then, you plot a path to where you want to go.
Think of customer trends, sales metrics, and more. All at your fingertips. Keep reading to discover the top tools that will make you a data wizard. We’re diving into the best of the best. These tools will help you soar above the competition. Let’s unlock the power of data together.
Quick List of 5 Business Intelligence tools
- Tableau: Visualize your data with interactive dashboards.
- Power BI: Microsoft’s tool for robust data analytics and reporting.
- QlikView: Offers self-service data discovery and quick insights.
- ExagoBI: Known for advanced analytics and machine learning capabilities.
- ClickData: Provides real-time analytics and helps you create custom data models.
Our reviewers evaluate software independently. Clicks may earn a commission, which supports testing. Learn how we stay transparent & our review methodology
Comparison Chart Of Business Intelligence Tools
Here’s a comparison chart of the mentioned Business Intelligence tools based on five key features:
Tool / Feature | Data Visualization | Integration | User Interface | Advanced Analytics |
 | Excellent interactive dashboards | Wide range, including SQL & Excel | User-friendly | Moderate, some machine learning |
 | Good, customizable dashboards | Primarily Microsoft-based | User-friendly | Deep analytics & AI integration |
 | Good, interactive charts | Wide range, including SAP | Slightly complex | Advanced, self-serve analytics |
 | Moderate, some customization | Moderate range, API available | Moderate ease of use | Strong, machine learning capabilities |
 | Good, real-time dashboards | Wide range, cloud-based | User-friendly | Moderate, real-time analytics |
What is Business Intelligence Tools?
Business Intelligence tools are software that turn raw data into meaningful insights. Business Intelligence tools are like GPS systems for businesses. Just as a GPS takes raw data about your location and route to guide you to your destination, these tools transform business data into a roadmap for success.
They tell you where you are, where you could go, and how to get there efficiently. Without them, you’re essentially driving blind in a world full of twists, turns, and roadblocks.
Why Are Business Intelligence Tools Important to Your Business?
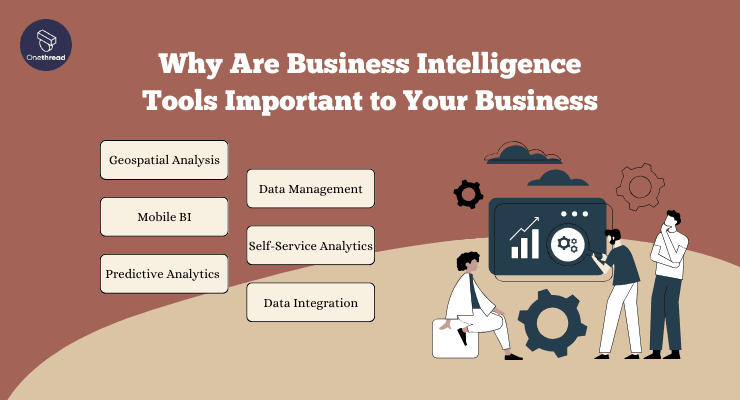
In today’s data-driven world, Business Intelligence (BI) tools are not just a luxury but a necessity. Below are key features that showcase why these tools are vital.
Geospatial Analysis
Maps tell stories. In business, knowing where your customers are can be gold. Geospatial analysis helps you understand location data. You can optimize store locations. You can target ads more effectively. The benefit? Higher sales and happier customers.
Mobile BI
Business doesn’t stop when you leave the office. Mobile BI lets you carry your data in your pocket. Check metrics on the go. Make quick decisions anytime, anywhere. This feature keeps you plugged in, no matter where you are.
Predictive Analytics
Imagine knowing the future. Predictive analytics comes close. It uses past data to forecast future trends. Some businesses may require custom machine learning development to create specialized predictive models tailored to their unique data and industry-specific needs.
This can guide your strategy. You can predict customer needs, stock levels, or even market changes. Make informed decisions, not guesses.
Data Management
Data is your business’s lifeblood. But it can be messy. Data management helps you clean, store, and use data wisely. Good data means good decisions. It makes every other BI feature more effective.
With the right embedded analytics tools, you can easily integrate data insights directly into your workflows, empowering teams to make faster, more informed decisions.
Self-Service Analytics
Not a data expert? No problem. Self-service analytics lets anyone dig into data. It’s user-friendly. Create your reports and dashboards. You don’t have to wait for the IT department. Empower your team to make data-driven choices.
Data Integration
Data can come from many places. Emails, databases, spreadsheets. Utilizing ETL tools can help you integrate data from various sources efficiently. Data integration combines it all. This gives you a full view of your business. It’s like piecing together a puzzle. The full picture helps you understand your business better.
To summarize, Business Intelligence tools are your roadmap in the complex business landscape. They help you navigate data, make informed decisions, and ultimately, achieve your business goals.
Top 5 Business Intelligence Tools
Here are the top 5 Business Intelligence tools you should consider. These platforms help you understand your data and grow your business. Let’s dive in.
#1. Tableau
Tableau is a data visualization tool. It helps you see and understand your data. You can connect it to various data sources like Excel, SQL, etc. Once connected, you can create charts, graphs, and dashboards.
It’s user-friendly; no coding is needed. Tableau offers real-time analytics and cloud support. It’s suitable for businesses of all sizes. The software has drag-and-drop features. This makes it easy to organize your data.
It also supports data blending and drill-down options. Security is robust, ensuring data integrity. Tableau is available in various versions: Desktop, Server, and Online. Each caters to different needs but maintains the core functionalities. With Tableau, data analysis becomes more straightforward and faster.
Tableau – Overview
- Company Valuation: $15 billion.
- Employee Numbers: 4,181
- Founding Team: Formally founded in January 2003 by Pat Hanrahan, Christian Chabot, and Chris Stolte
Features
Data Visualization
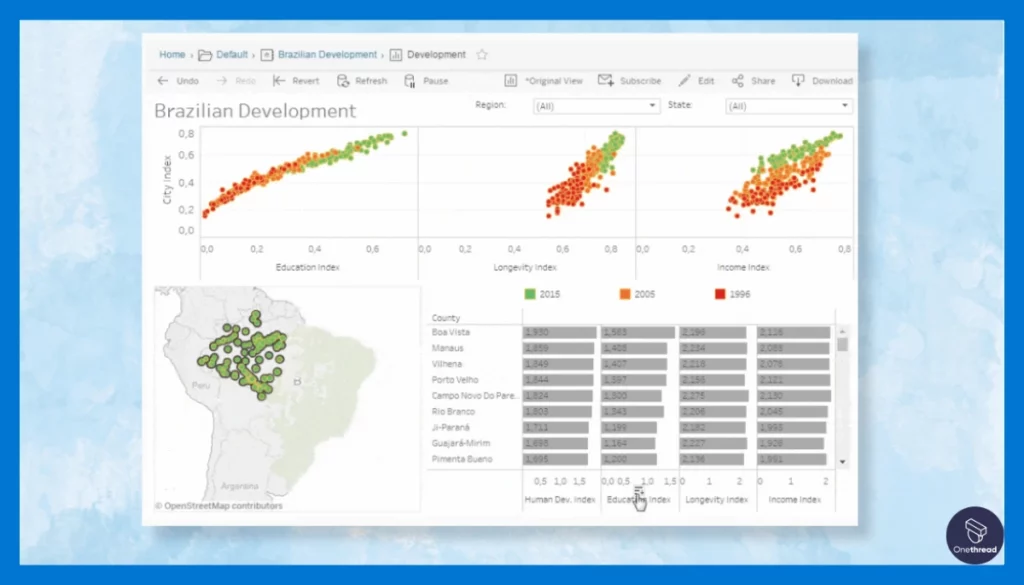
Tableau allows you to create interactive and shareable dashboards. These dashboards provide a dynamic way to view your data. You can drill down to specific metrics or view large-scale trends at a glance. The best part? You don’t need to be a tech wizard to navigate its user-friendly interface.
Data Integration
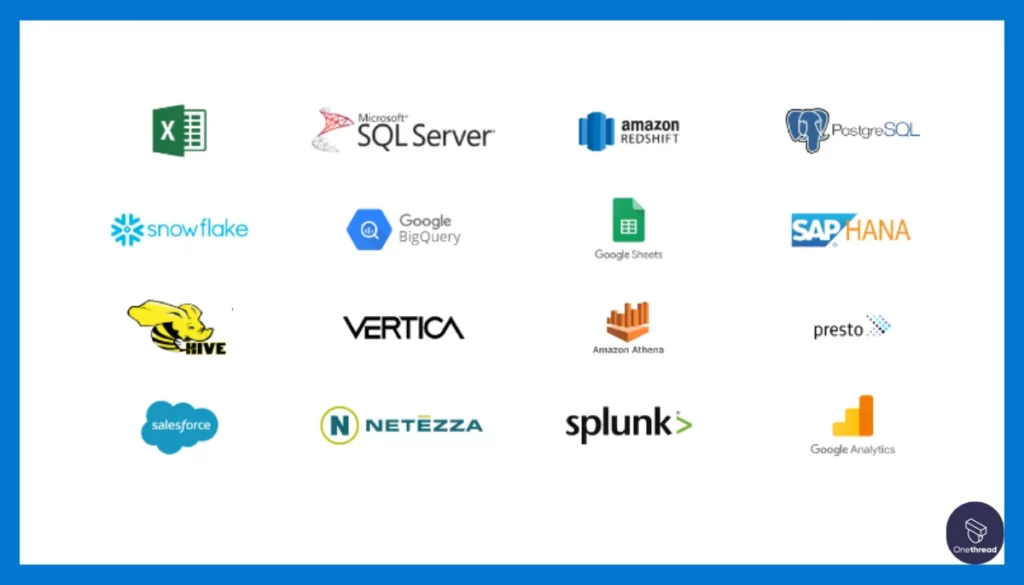
Tableau integrates seamlessly with various data platforms. From SQL databases to Excel spreadsheets, it can pull it all together. This creates a holistic view of your business, streamlining decision-making.
Real-Time Analytics

Tableau updates your data in real-time. This ensures you’re making decisions based on the most current information. No more waiting for monthly reports.
Collaboration
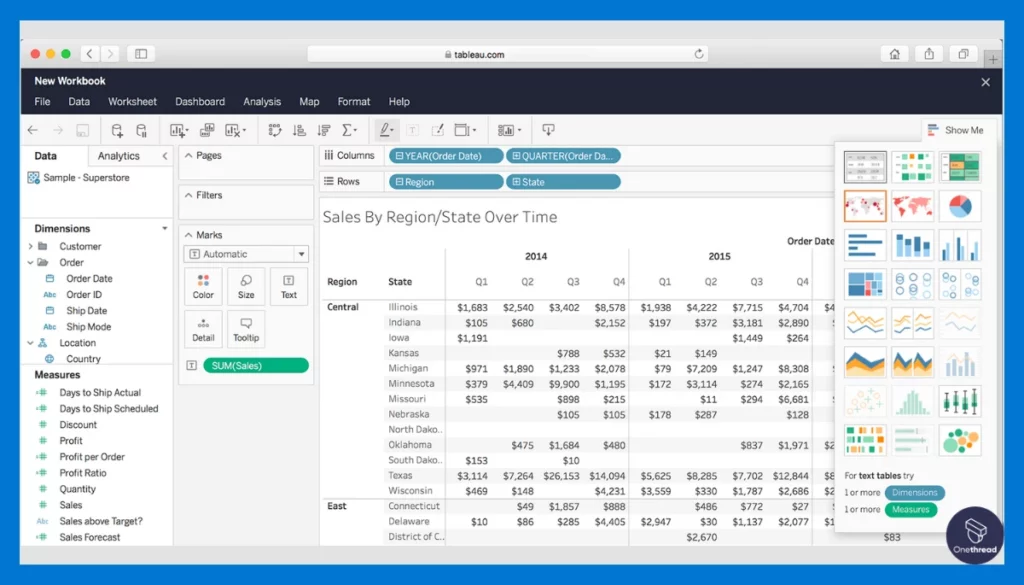
Tableau makes it easy to share your insights. You can publish dashboards and share reports with team members. This fosters a collaborative data culture within your organization.
Scalability
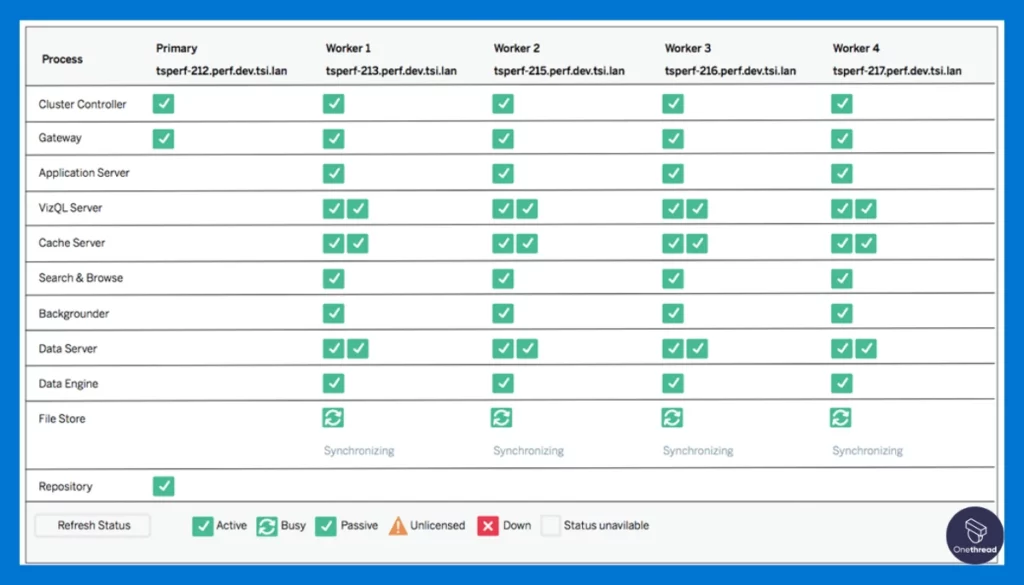
Whether you’re a small startup or a large corporation, Tableau offers scalable solutions. This means you won’t outgrow the platform as your data needs become more complex.
Pros & Cons
- Pros:
- User-friendly interface
- Robust data integration
- Real-time analytics
- Excellent collaboration features
- Highly scalable
- Cons:
- Can be expensive
- May have a learning curve for advanced features
Pricing Plans
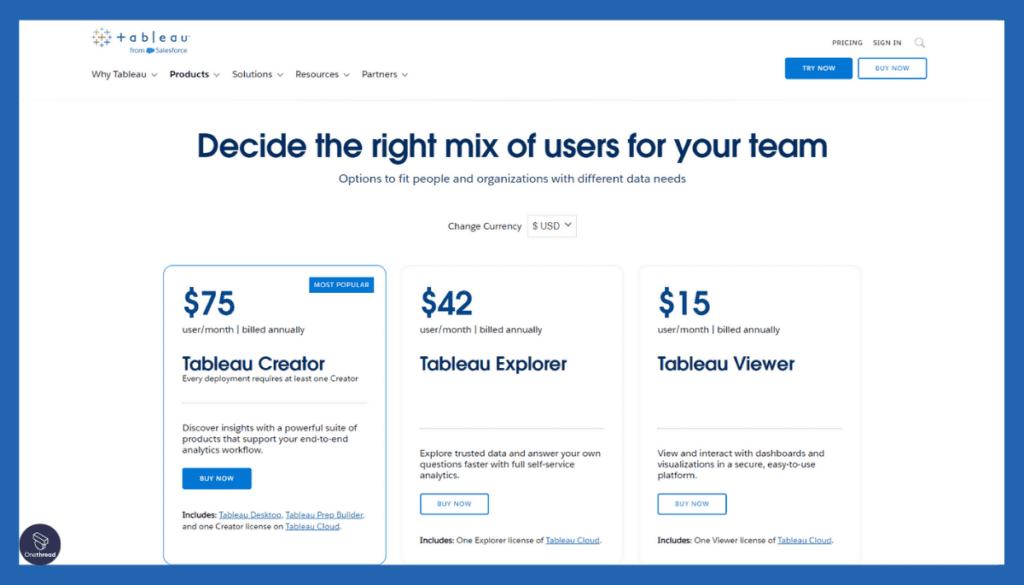
- Individual: $70/user/month
- Professional: Starts at $35/user/month
- Enterprise: Custom pricing
Customer Ratings
- G2: 4.3 out of 5 stars
- Capterra: 4.5 out of 5 stars
Review
Tableau is a leading data visualization tool. It’s user-friendly, offering drag-and-drop features. This makes it easy for people who aren’t tech-savvy. It integrates well with many data sources. That’s a big plus for businesses with diverse data.
However, it’s not perfect. The software can get expensive. Small businesses may find the cost hard to justify. Learning advanced features can also be time-consuming. This could slow down your team’s productivity initially.
Overall, Tableau excels in making data understandable. But the cost and learning curve are drawbacks to consider. It’s best for companies that have complex data needs and the budget to match.
#2. Power BI
Power BI is a business analytics tool from Microsoft. It turns raw data into meaningful insights. You can connect it to a wide range of data sources. It offers cloud-based and on-premises options.
The interface is intuitive, with drag-and-drop features. This makes it easy to create reports and dashboards. Power BI supports real-time analytics. It allows for data sharing and collaboration.
The tool is highly scalable, fitting both small businesses and large enterprises. Security features are robust, ensuring data safety.
Power BI- Overview
- Company Valuation: $8.9 billion
- Founding Team: Started in 2006 as the brainchild of Thierry D’hers and Amir Netz from Microsoft’s SQL Server Reporting Services Team.
Features
Data Analytics
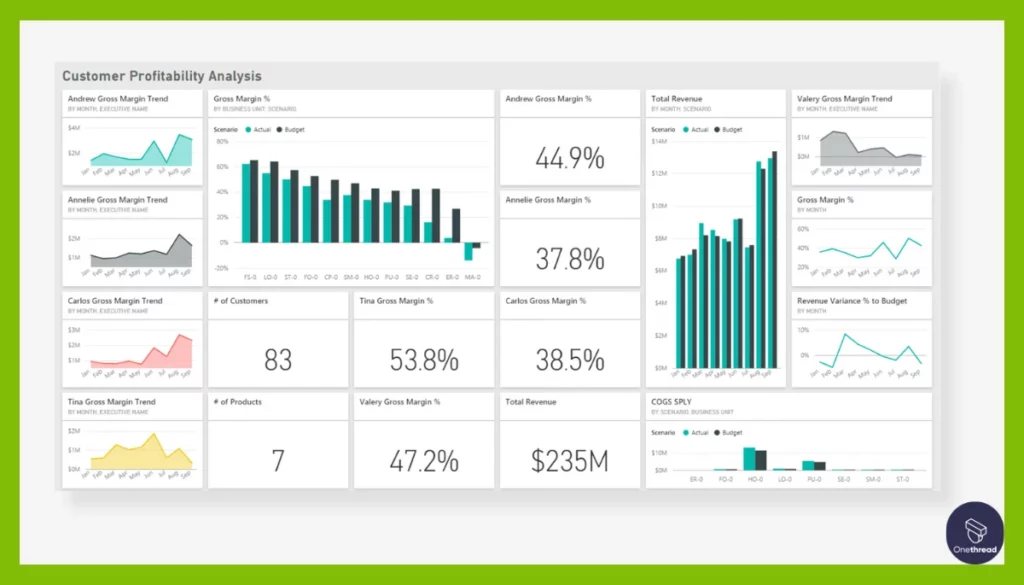
Power BI can handle complex queries with ease. This is a crucial asset when you’re swimming in a sea of data points. It takes you from data collection to business strategies without breaking a sweat. It’s like having a data scientist on your desktop.
Seamless Microsoft Integration
This is the go-to BI tool if you’re already using Microsoft products. It integrates effortlessly with Microsoft 365, Azure, and more. You get a streamlined flow of data across all Microsoft platforms; no need for manual transfers or conversions.
Customizable Dashboards
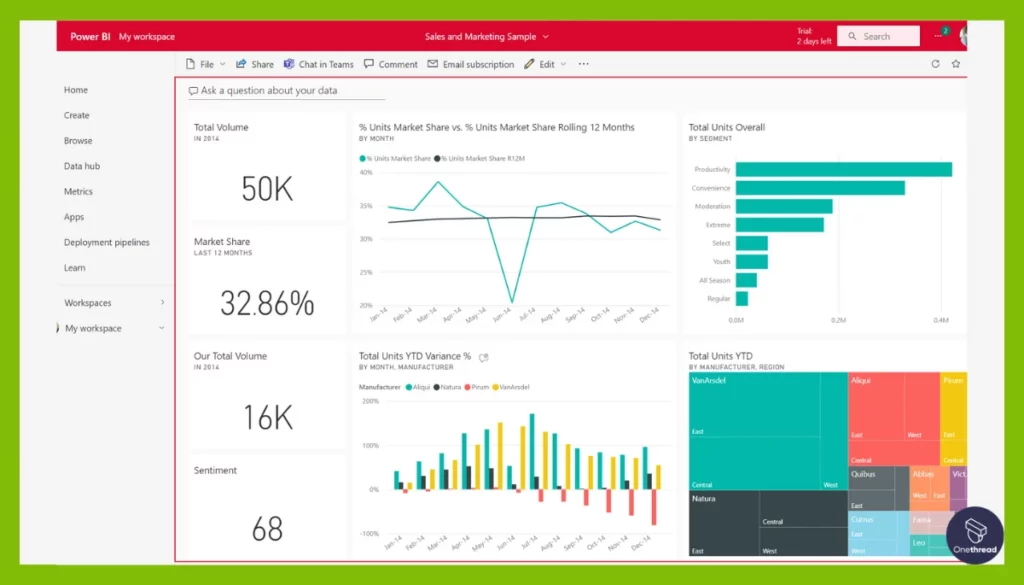
Power BI gives you the freedom to create your dashboards and tailor them to meet your unique business needs. You can also use pre-built templates. Either way, you get a real-time view of key metrics and KPIs.
Natural Language Queries
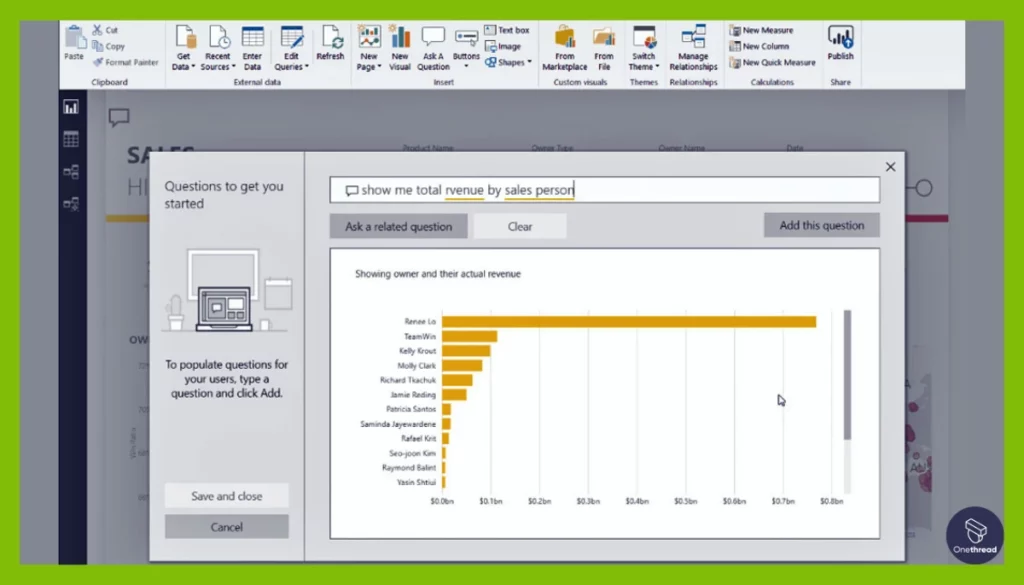
The power to ask questions in plain English is a game-changer. There is no need for complex code or queries. Just type what you want to know. Power BI processes it and delivers answers.
Data Security
When it comes to data, security is non-negotiable. Power BI offers strong encryption and role-based access control. Your data stays in safe hands, whether it’s in transit or at rest.
Pros & Cons
- Pros:
- Deep data analytics
- Smooth Microsoft integration
- Customizable dashboards
- Natural language queries
- Strong data security
- Cons:
- Limited integration with non-Microsoft platforms
- Might be overkill for small businesses
Pricing Plans
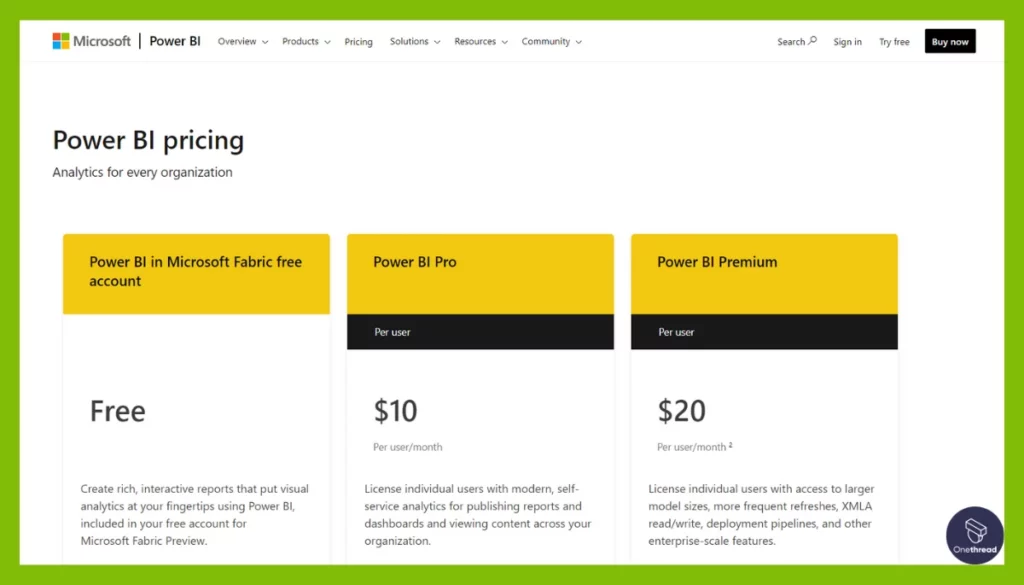
- Pro: $9.99/user/month
- Premium: Starts at $4,995/month
- Embedded: Custom pricing
Customer Ratings
- G2: 4.1 out of 5 stars
- Capterra: 4.4 out of 5 stars
Review
Power BI is a strong contender in the data visualization field. Created by Microsoft, it integrates seamlessly with other Microsoft products. This is a big advantage for businesses already using the Microsoft ecosystem. Its interface is intuitive, enabling quick data analysis and report generation.
On the downside, Power BI has limitations on data storage and refresh rates in its cloud-based service. If your data is very large, you may hit these limits. Additionally, the software can be less flexible than some competitors regarding custom visuals.
Power BI is a reliable, efficient tool for data visualization, especially for Microsoft users. However, it may not be the best fit for those with extremely large data sets or the need for highly customized visuals.
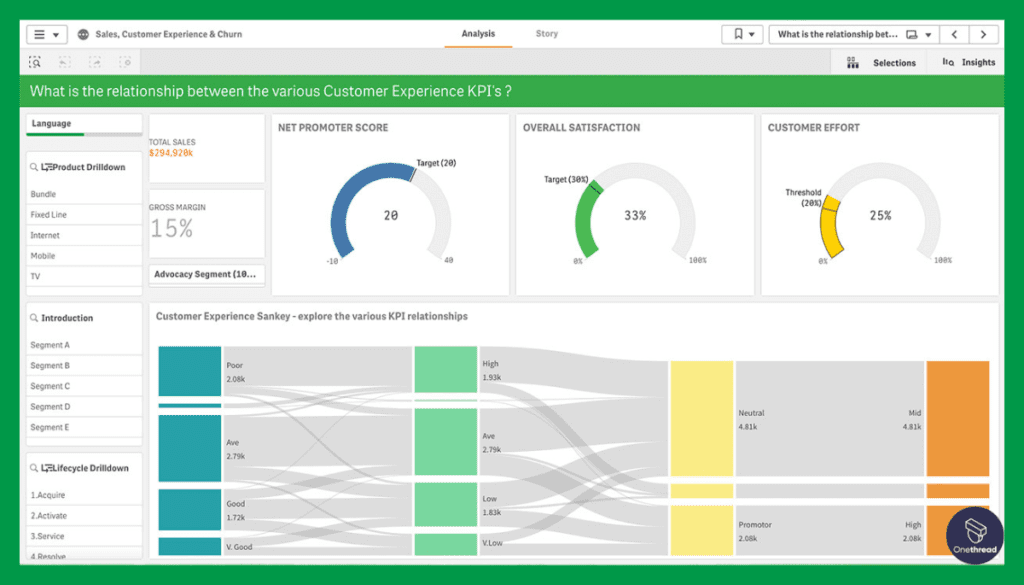
#3. QlikView
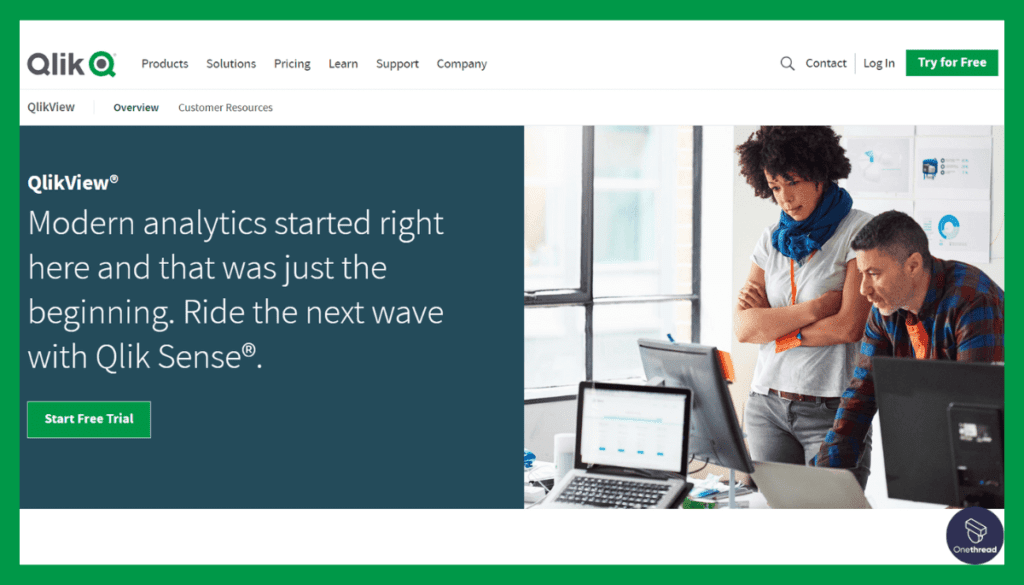
QlikView is a business intelligence tool for data visualization and discovery. It was developed by Qlik, a leader in the analytics field. The software allows you to connect with multiple data sources.
You can then create interactive dashboards and reports. It uses associative modeling, enabling complex data discovery. QlikView is highly customizable and offers a drag-and-drop interface. This makes it user-friendly. You can conduct real-time analytics, explore hidden trends, and generate insights.
Security features are top-notch to ensure data integrity. It also offers mobile accessibility, allowing you to view reports on the go. QlikView is suited for businesses of all sizes, offering cloud-based and on-premises solutions. Overall, it’s a powerful tool for in-depth data analysis.
Qlik- Overview
- Company Valuation: $3 billion.
- Employee Numbers: 32 employees
- Founding Team: QlikView was founded in Lund, Sweden in 1993, by Bjorn Berg and Staffan Gestrelius.
Features
Self-Service Data Discovery
The self-service data discovery in QlikView lets you search and assemble data from various sources. You can pull data from spreadsheets, databases, or cloud storage. The idea is to let you, the user, play with data, find trends, and build reports without needing a data scientist.
Associative Model
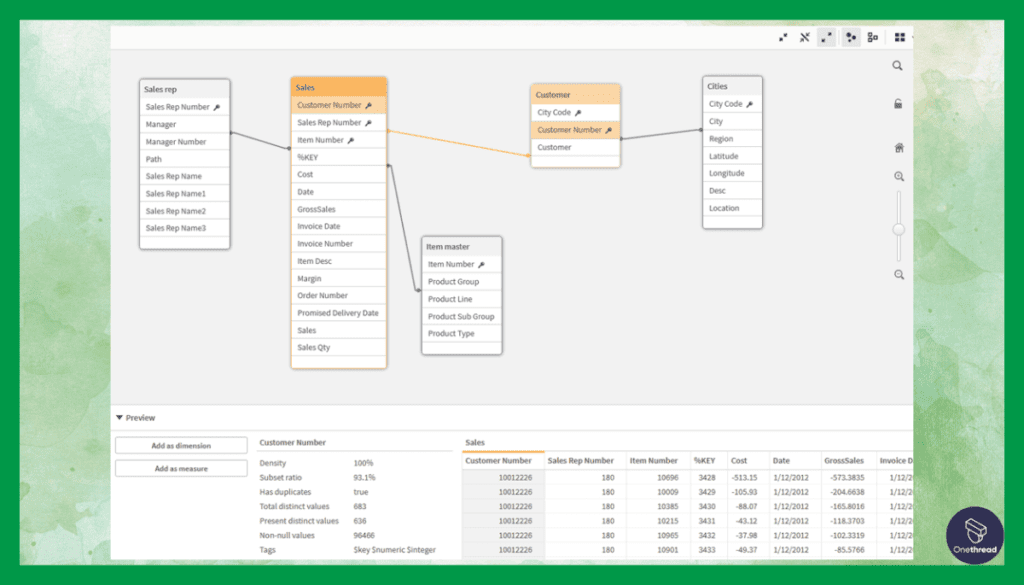
The associative model is QlikView’s unique selling point. Unlike traditional BI tools that query data in a linear way, QlikView lets you explore data from multiple angles.
In-memory processing
QlikView uses in-memory processing to speed up data retrieval and analysis. This means less waiting and more doing. The quick processing time ensures that you can make timely decisions based on the latest data.
Highly Interactive Dashboards
QlikView dashboards are interactive so you can click on data points for more details. You can also change variables to see how it impacts results. This level of interactivity enhances user engagement and deepens data comprehension.
Mobile Accessibility
Business happens on the go, and QlikView knows that. That’s why it offers mobile BI features. You can access reports and dashboards from your smartphone or tablet.
Pros & Cons
- Pros:
- User-friendly self-service
- Unique associative model
- Fast in-memory processing
- Interactive dashboards
- Mobile support
- Cons:
- Steeper learning curve for advanced features
- May be costly for small businesses
Pricing Plans
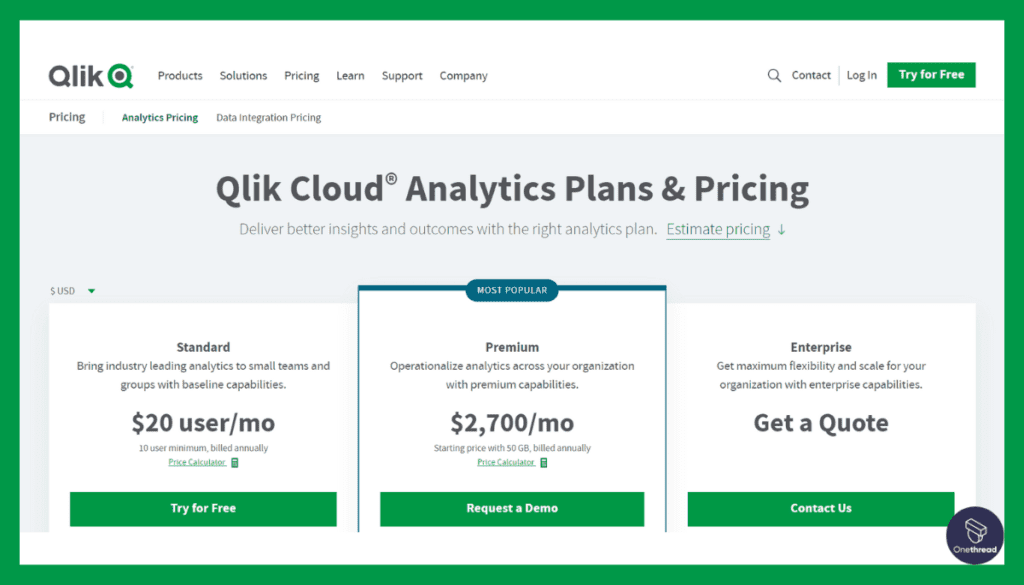
- Personal Edition: Free
- Small Business Edition: Starts at $1,350 per month
- Enterprise Edition: Custom pricing
Customer Ratings
- G2: 4.0 out of 5 stars
- Capterra: 4.2 out of 5 stars
Review
QlikView is a business intelligence tool known for its speed and in-memory data processing. It offers robust data modeling and is highly customizable. This allows for tailored solutions to specific business needs. Its associative model helps in uncovering hidden trends, making data discovery effective.
However, QlikView has its shortcomings. Its pricing model can be complex and may become expensive as more features are added. The tool also has a steeper learning curve compared to its competitors. This can be a barrier for users who are not tech-savvy.
QlikView excels in data modeling and customization but falls short in user-friendliness and straightforward pricing. It’s a powerful tool, but be prepared for a learning curve and potential cost escalation.
#4. ExagoBI
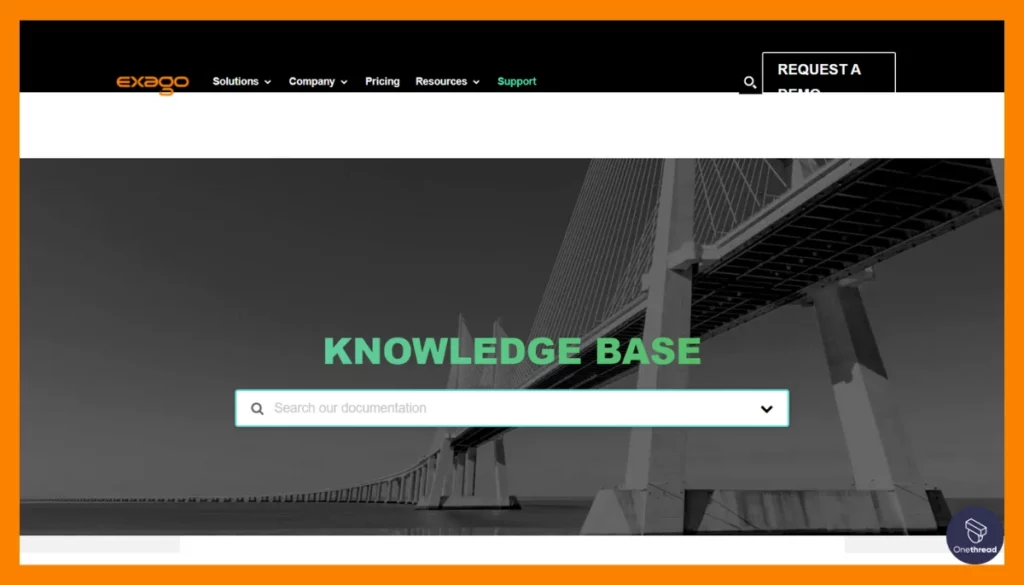
Exago BI is a web-based business intelligence tool. It specializes in embedded analytics. This means you can integrate it directly into other software applications. It offers report building, dashboard creation, and data visualization.
Users don’t need to be tech-savvy to use it. It’s designed for ease with a drag-and-drop interface. Exago BI supports various data sources like SQL databases and Excel files. It allows for real-time analytics and data exploration.
The software is highly flexible and customizable. This lets you tailor the tool to specific business needs. Security features are strong, ensuring data safety. It’s a scalable solution suitable for both small businesses and large enterprises.
Exago BI – Overview
- Employee Numbers: 70 employees
- Founding Team: Stewart Meyers, Co-founder and CTO.
Features
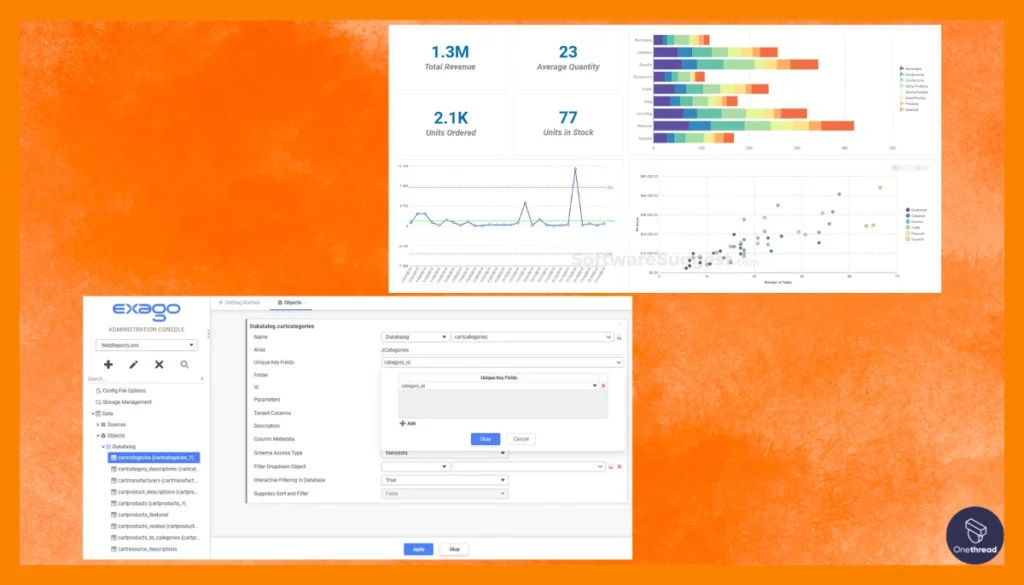
Advanced Analytics
ExagoBI is a trailblazer when it comes to advanced analytics. The tool is designed for businesses that need more than just surface-level insights. If you’re dealing with intricate data sets and need to go deep, ExagoBI has you covered.
Machine Learning Capabilities
ExagoBI can learn from your data patterns to make predictions. This means it gets smarter as you use it. Over time, it helps you spot opportunities or risks before they become obvious. It’s like a crystal ball for your business.
White-Labeling
ExagoBI allows you to white-label its interface. This means you can put your own brand on the platform. You can customize it to look and feel like a part of your business.
API-First Design
ExagoBI is built with an API-first design. This means it can easily integrate with your existing systems. No need for complex coding or expensive consultants. Plug it in, and you’re good to go.
Scalability
As your business grows, so does your need for data analysis. ExagoBI is scalable. Whether you’re a startup or a large corporation, it can handle your needs. This gives you peace of mind, knowing that the tool will grow with you.
Pros & Cons
- Pros:
- Robust advanced analytics
- Smart machine learning features
- Customizable white-labeling
- Easy API integrations
- Scalable for businesses of all sizes
- Cons:
- May be too complex for small businesses
- Higher pricing tier
Pricing Plans
- Starter: Custom pricing
- Pro: Custom pricing
- Enterprise: Custom pricing
Customer Ratings
- G2: 4.3 out of 5 stars
- Capterra: 4.5 out of 5 stars
Review
Exago BI specializes in embedded analytics. It integrates smoothly into existing software, making it a good choice for companies that want to add BI features to their platforms. Its reporting is dynamic and can include interactive dashboards, which is a plus for user engagement.
However, Exago BI does have downsides. Its user interface is often less intuitive, making the initial setup and usage challenging for non-technical users. Additionally, its data visualization capabilities are less advanced than leading competitors like Tableau or Power BI.
Exago BI shines in embedded analytics and dynamic reporting but lags in user-friendliness and advanced data visualization. It’s well-suited for companies looking to integrate BI into existing systems but may not be ideal for those needing advanced standalone solutions.
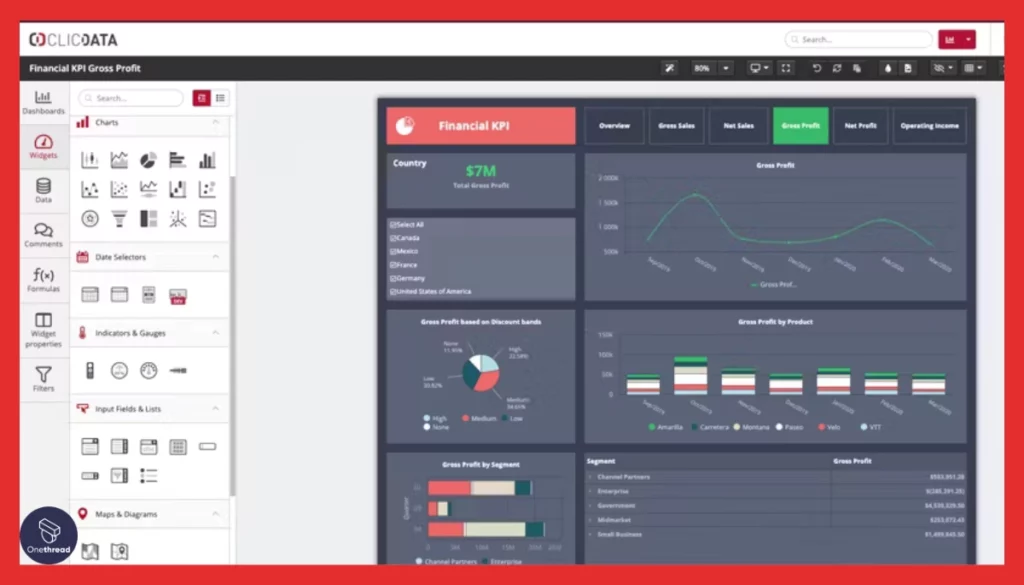
#5. ClickData
ClickData is a business intelligence tool focused on dashboards and data visualization. It’s cloud-based, making it easy to access from anywhere. You can connect it to various data sources like SQL databases, Excel, and various APIs.
The platform offers pre-built templates to speed up dashboard creation. Its drag-and-drop interface is user-friendly, requiring no coding skills. ClickData supports real-time analytics, updating dashboards automatically.
Collaboration is easy; you can share insights with team members in just a few clicks. It offers strong security measures to protect your data. The tool is scalable, catering to businesses of all sizes.
ClickData – Overview
- Employee Numbers: 30 employees.
- Founding Team: Rend Stephan – the Chief Executive Officer
Features
Real-Time Analytics
ClickData shines in real-time analytics. The moment data enters your system, it’s available for analysis. No more waiting for reports to update. This is crucial for businesses where time-sensitive decisions make a difference.
Custom Data Models
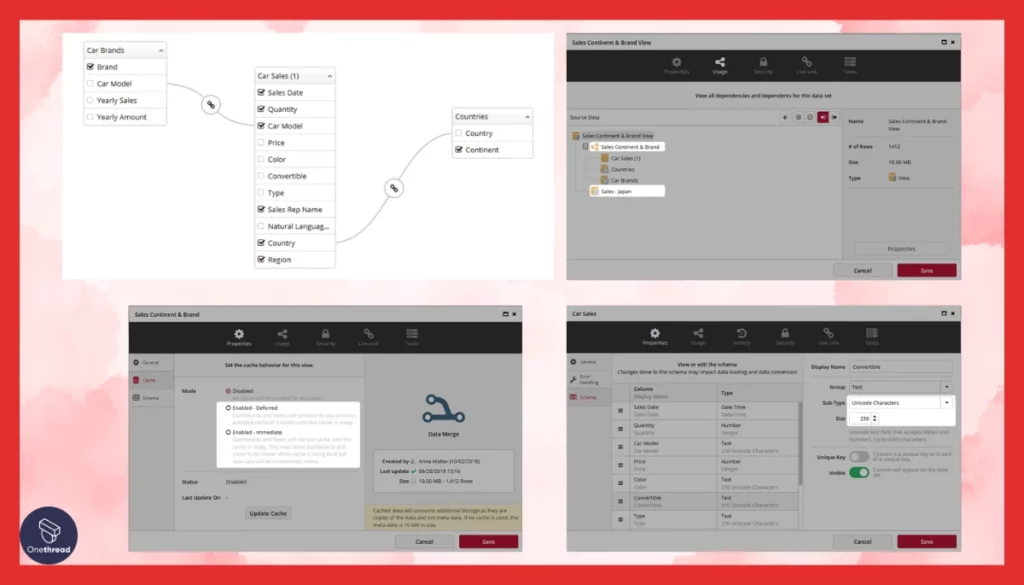
With ClickData, you’re not stuck with preset data models. You can create custom ones to suit your needs. This is great for businesses with unique workflows or specialized industries.
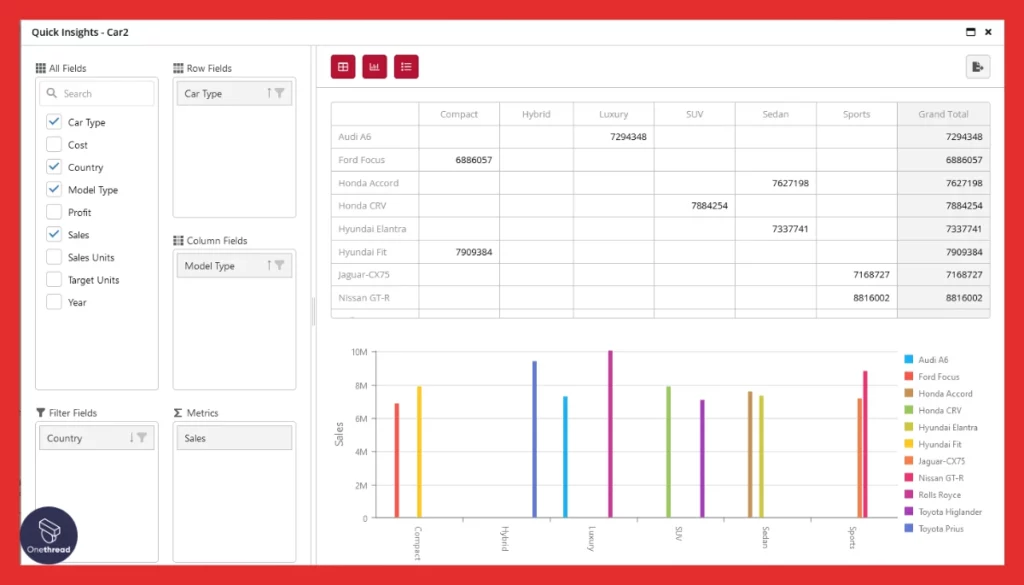
Advanced Visualizations
ClickData offers advanced visualization options. From simple pie charts to intricate heat maps, the choice is yours. It’s akin to having a full paint palette for your data, not just basic colors.
Seamless Integrations
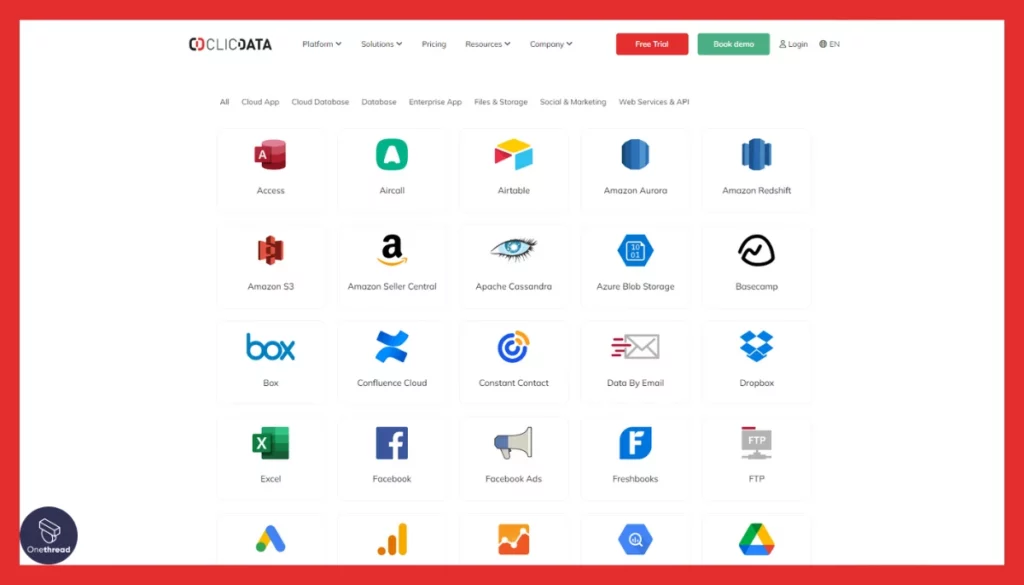
ClickData integrates seamlessly with popular business applications. Think of it as a universal remote that easily pairs with your existing devices, making life easier.
User-Friendly Interface
An easy-to-use interface makes all the difference. ClickData is designed with the user in mind. You’ll find it intuitive whether you’re a data novice or a pro.
Pros & Cons
- Pros:
- Instant real-time analytics
- Customizable data models
- Diverse visualizations
- Easy integrations
- User-friendly design
- Cons:
- May require some initial setup
- Higher cost for advanced features
Pricing Plans
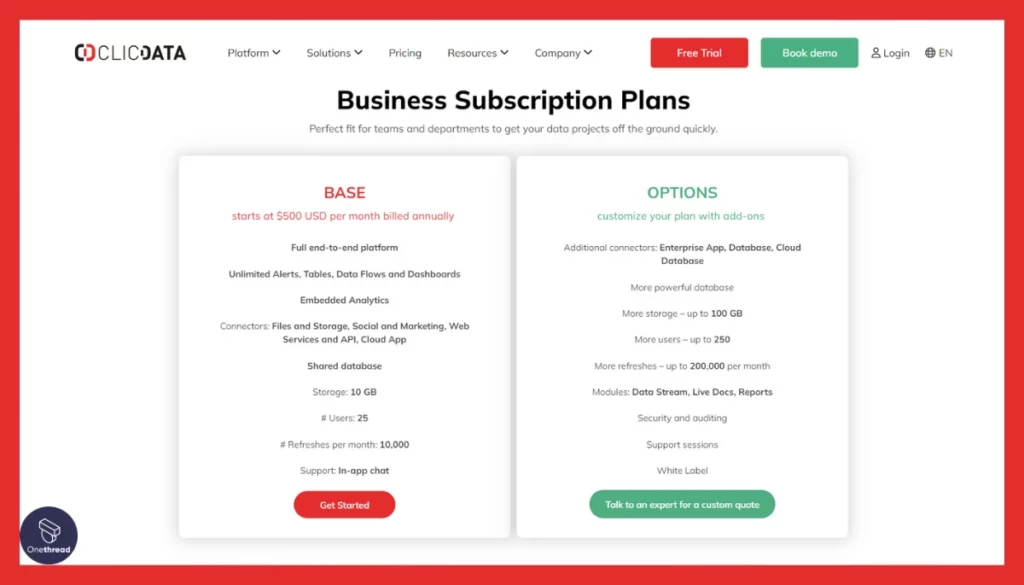
- Basic: Starts at $200 per month
- Pro: Starts at $500 per month
- Enterprise: Custom pricing
Customer Ratings
- G2: 4.1 out of 5 stars
- Capterra: 4.3 out of 5 stars
Review
ClickData is focused on real-time business dashboards and analytics. It boasts easy-to-use features that let users create dashboards quickly. It also supports real-time updates, which is crucial for fast-paced businesses. Integration with multiple data sources is another strength, offering users flexibility.
However, ClickData has limitations. Its customization options are somewhat limited, restricting the ability to tailor dashboards to specific needs. The user interface can be overwhelming for new users, making it less accessible for those unfamiliar with BI tools.
ClickData is a solid option for real-time analytics and dashboard creation but falls short in customization and user-friendliness. It’s well-suited for businesses that prioritize real-time updates but may not be the best for those needing highly customized solutions.
Getting the Most Out of Business Intelligence Tools
To unlock the full potential of Business Intelligence tools, it’s not just about the tech. It’s also about how you use it. Want to get ahead? Follow these best practices:
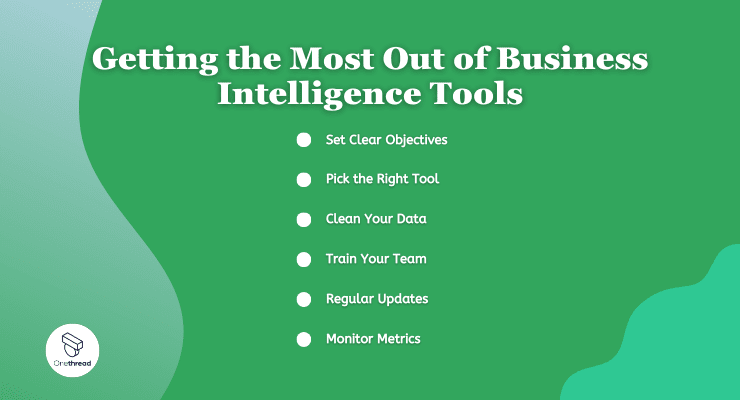
- Set Clear Objectives: Know what you want to achieve.
- Pick the Right Tool: Not all BI tools are created equal. Choose one that aligns with your needs.
- Clean Your Data: Garbage in, garbage out. Ensure your data is clean and structured.
- Train Your Team: A tool is only as good as the person using it. Invest in training.
- Regular Updates: Keep your tool updated for optimal performance.
- Monitor Metrics: Keep an eye on KPIs to gauge success.
By following these best practices, you’ll get more value from your Business Intelligence tool. Make data work for you, not the other way around.
Summary
Business Intelligence tools are game-changers for businesses. They offer real-time insights, deep analytics, and data-driven decision-making.
Picking the right tool and using it wisely can set your business up for success. Don’t miss out on the chance to make smarter, faster decisions that drive growth. Get on board the BI train now.
FAQs
Are they hard to use?
Ease of use varies. Some offer simple dashboards, others may require training. Check if the tool fits your skill level.
What’s the cost?
Pricing ranges from free versions to premium plans costing hundreds per month. Know your budget and compare options.
Do they integrate with other tools?
Most BI tools integrate with everyday business apps like CRM systems, databases, or cloud storage services.