If you’re new to project management, you may be overwhelmed by the different types of charts and tools that are available to help you plan your work. Two popular options are PERT charts and Gantt charts, each with their own unique features and benefits.
Understanding the difference between PERT and gantt chart can help you decide which one is best suited for your needs. PERT and Gantt charts both provide a visual representation of project tasks and timelines, but they approach this task in different ways.
PERT charts are designed to map out complex projects with many interdependent tasks, while Gantt charts focus on identifying key milestones and deadlines.
By understanding difference between PERT and gantt chart, you can choose the one that will give you the most insights into your project’s progress and help you stay on track towards success.
Understanding PERT Charts for Project Management
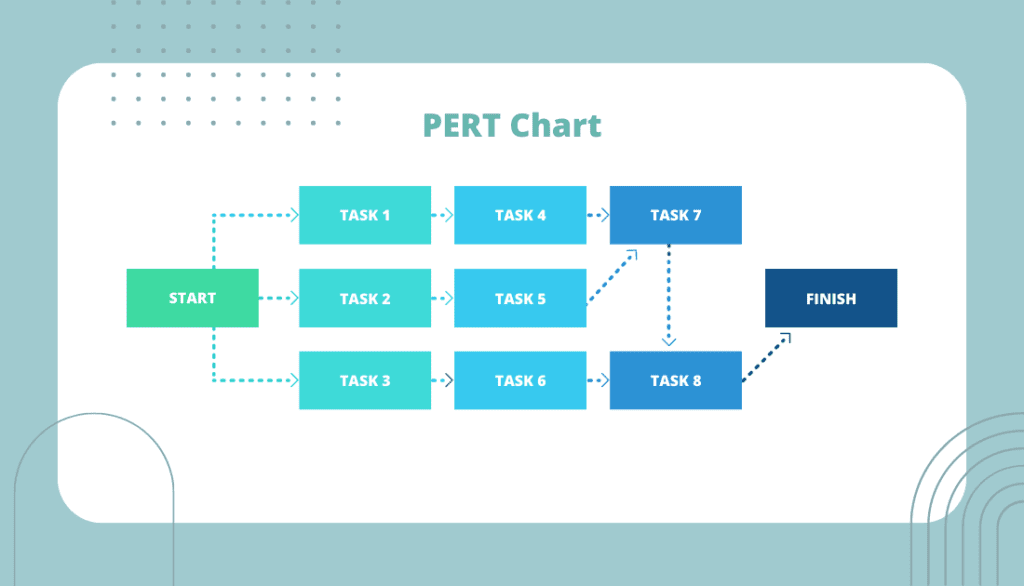
PERT charts are a valuable tool in project management that aid in analyzing and visualizing project timelines. PERT, which stands for Program Evaluation Review Technique, is a visual representation tool used in project management.
PERT charts help break down and represent the various tasks involved in completing a project, allowing for a comprehensive analysis of timelines and dependencies.
Origin and Purpose of PERT Methodology
The PERT methodology was developed in the 1950s by the U.S. Navy to effectively manage large and complex projects. PERT charts provide a comprehensive overview of project tasks and activities, enabling project managers to develop realistic timelines for project completion.
Benefits of PERT Analysis
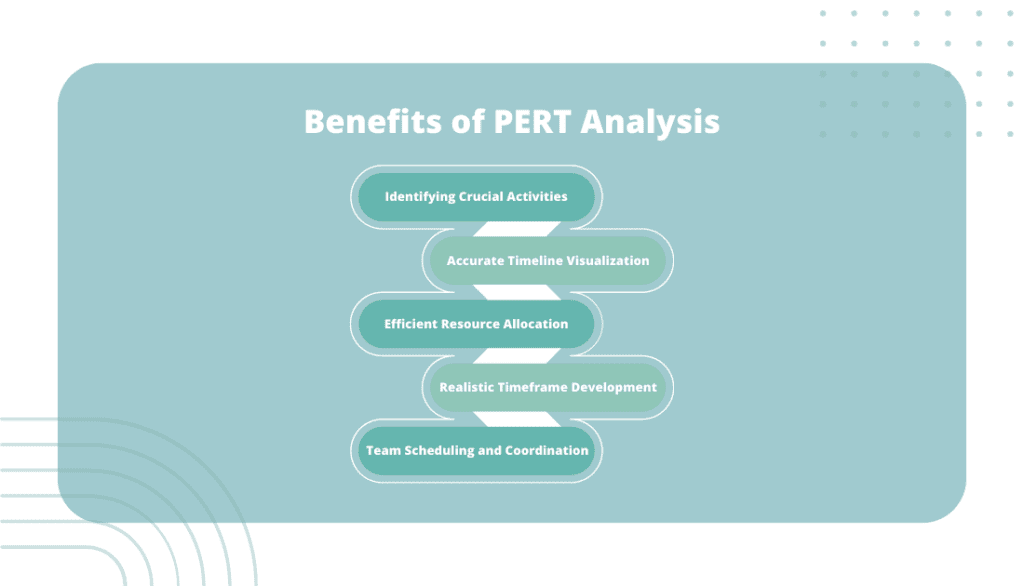
By utilizing PERT charts, project managers can gain several benefits, including:
- Identifying Crucial Activities: PERT analysis helps pinpoint the most critical activities within a project, allowing managers to prioritize them appropriately.
- Accurate Timeline Visualization: PERT charts provide a visual representation of each task’s timeline, enabling project managers to understand the project’s overall timeframe more effectively.
- Efficient Resource Allocation: With PERT charts, project managers can identify critical paths that require close monitoring and allocate resources efficiently, maximizing productivity.
- Realistic Timeframe Development: With PERT charts, project managers can establish realistic timeframes by analyzing task dependencies and estimating the time required for each activity.
- Team Scheduling and Coordination: PERT charts assist in scheduling and coordinating team members, ensuring efficient task allocation and collaboration.
Use Cases for PERT Charts
PERT charts find applications in various project management scenarios, such as:
- Research and Development Projects: PERT charts assist in planning and tracking research and development projects, ensuring timely completion of tasks.
- Construction Projects: PERT analysis helps construction project managers schedule activities, coordinate resources, and identify critical paths to avoid delays.
- Software Development Projects: PERT charts aid software project managers in managing development tasks, tracking dependencies, and optimizing project schedules.
PERT charts play a crucial role in project management by providing a visual representation of project timelines and identifying critical paths. By understanding the benefits and use cases of PERT charts, project managers can effectively plan, allocate resources, and monitor complex projects, leading to successful project completion.
Understanding Gantt Charts for Effective Task Management
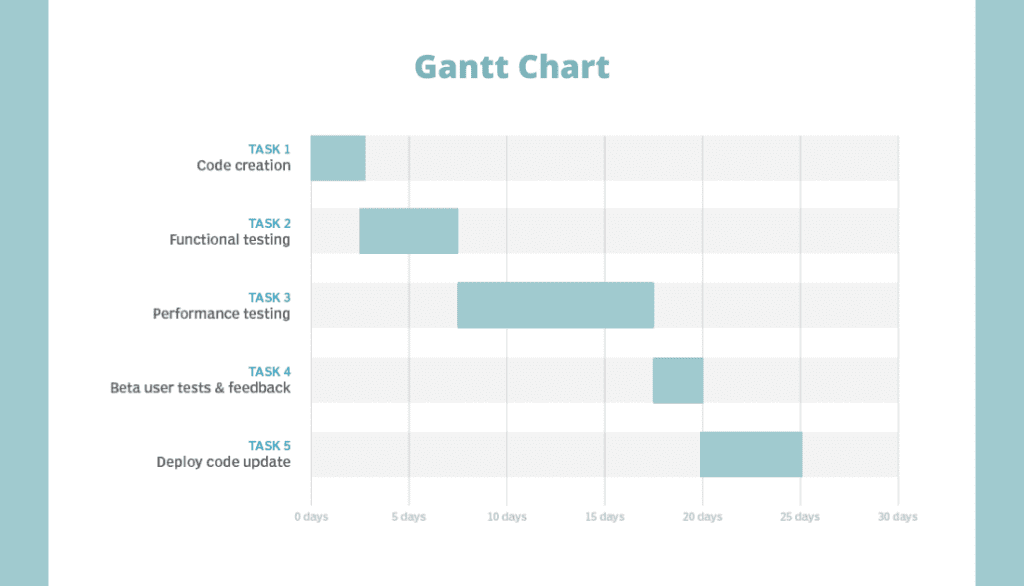
Gantt charts, developed by Henry Gantt in 1910, provide a linear representation of project tasks. Gantt charts are visual representations of project tasks, where each task is represented by a horizontal bar displaying its duration, start date, and end date. They provide a clear overview of the project timeline and task dependencies.
Benefits of Gantt Charts in Team Collaboration
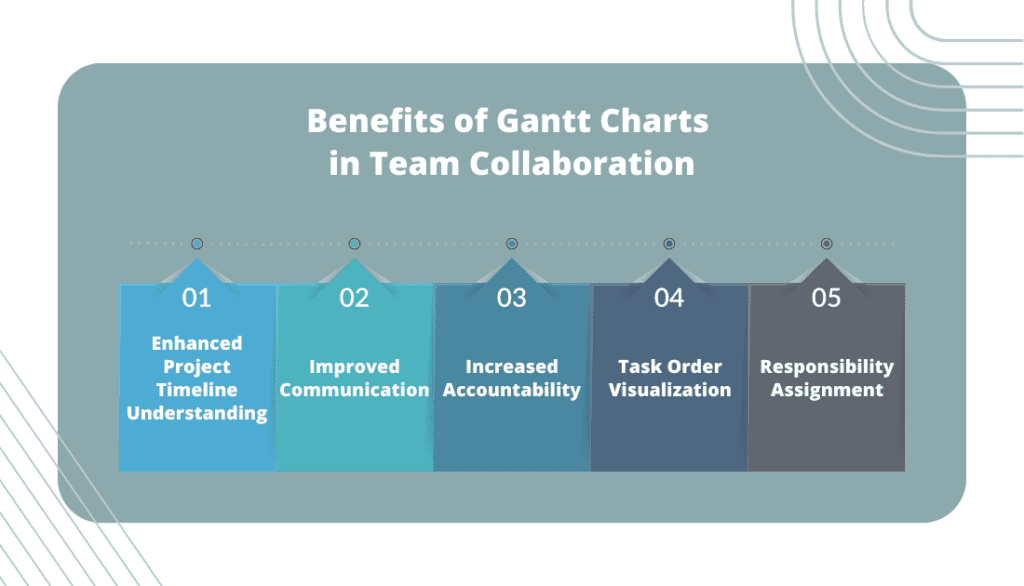
Gantt charts offer several advantages when it comes to team collaboration, including:
- Enhanced Project Timeline Understanding: With tasks laid out in a Gantt chart, it becomes easier to comprehend the duration of each task and its completion deadline.
- Improved Communication: Gantt charts facilitate transparent communication by making task assignments and deadlines visible to the entire team, reducing confusion and clarifying responsibilities.
- Increased Accountability: When team members have visibility into their tasks and deadlines, they are more likely to take ownership and accountability for their work.
- Task Order Visualization: The linear structure of Gantt charts helps visualize the sequential order of tasks, ensuring smooth project progression and identifying dependencies.
- Responsibility Assignment: Gantt charts enable project managers to assign specific teams or individuals responsible for each task, enhancing accountability and collaboration.
Gantt Chart Software and Collaboration Features
Popular examples of Gantt chart software include Onethread, Microsoft Project, Smartsheet, and Trello. These tools offer user-friendly interfaces with drag-and-drop functionality for creating Gantt charts. Moreover, they provide built-in collaboration features, enabling seamless teamwork and real-time updates.
Gantt charts are an invaluable asset in project management, allowing for visual representation of project timelines and facilitating effective task management. By leveraging the benefits of Gantt charts in team collaboration, project managers can enhance communication, promote accountability, and achieve successful project outcomes.
Difference Between PERT And Gantt Chart – Head to Head Comparison
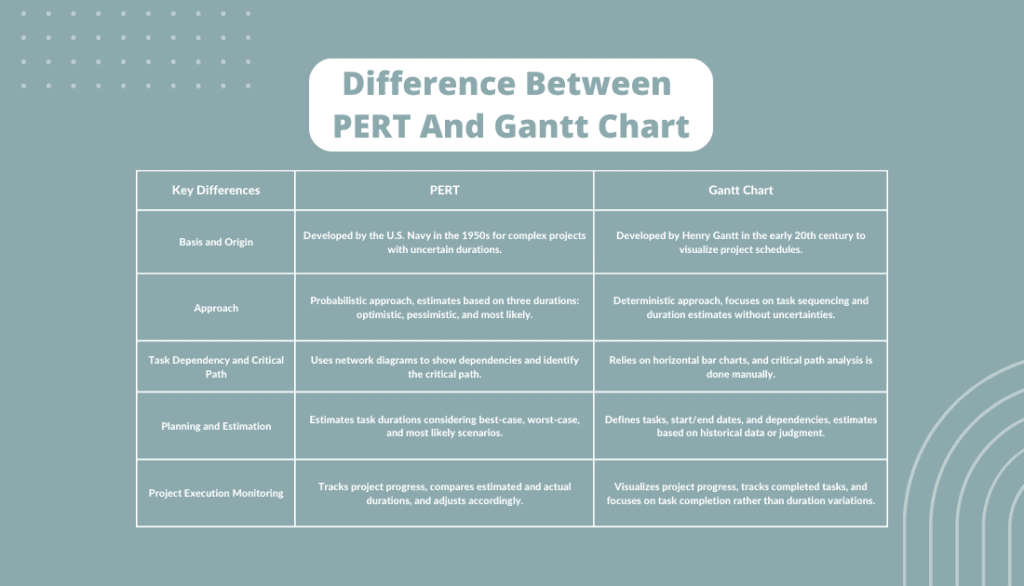
PERT Chart vs Gantt Chart are two commonly used tools in project management that offer different perspectives and serve different purposes. Here is an in-depth comparison highlighting the key differences between Gantt Chart vs PERT Chart:
1. Basis and Origin
Gantt Chart: The Gantt Chart is based on Project Management Theory and was developed by Henry Gantt in 1910. It provides a visual representation of project tasks, durations, and dependencies.
PERT Chart: PERT (Program Evaluation and Review Technique) Chart uses the critical path method and was initially proposed by the US Navy in 1957. It gained popularity in project management practices about 30 years later.
2. Approach
Gantt Chart: The Gantt Chart focuses on displaying the project schedule in a linear timeline format. It emphasizes the order of tasks, their durations, and the responsible individuals or teams. It helps in visualizing project progress and resource allocation.
PERT Chart: The PERT Chart primarily uses the critical path method to identify the critical path and determine the minimum time required to complete a project. It analyzes task dependencies and calculates durations based on these relationships.
3. Task Dependency and Critical Path
Gantt Chart: While Gantt Charts can show task dependencies, they do not explicitly highlight the critical path. Task dependencies are usually represented through task interconnections, but the critical path analysis is not a central focus.
PERT Chart: PERT Charts excel in identifying and visualizing the critical path of a project. By analyzing task dependencies, PERT Charts determine the longest path through a project, which helps in understanding the most critical tasks and potential bottlenecks.
4. Planning and Estimation
Gantt Chart: Gantt Charts are widely used for planning projects, scheduling tasks, and managing project resources. They provide a clear overview of the project timeline, allowing project managers to allocate resources and monitor progress.
PERT Chart: PERT Charts are particularly suitable for projects with multiple tasks, milestones, or deliverables. They facilitate task planning by identifying the sequence of activities and estimating their durations using optimistic, most likely, and pessimistic estimates. PERT Charts assist in determining the expected completion date and assessing project feasibility.
5. Project Execution Monitoring
Gantt Chart: Gantt Charts primarily focus on displaying the project schedule and timeline. They provide a static view of the project, allowing stakeholders to understand the planned schedule and milestones. However, Gantt Charts do not provide detailed information on day-to-day execution or progress tracking.
PERT Chart: PERT Charts are not specifically designed for day-to-day progress tracking. They are more useful for analyzing critical tasks and identifying potential delays. PERT Charts provide insights into the overall project timeline, but they do not offer real-time monitoring capabilities.
In summary, Gantt Charts are effective for visualizing project schedules, managing resources, and tracking progress, while PERT Charts are valuable for identifying critical paths, estimating project durations, and analyzing task dependencies. The choice between these two tools depends on the specific project requirements and the level of detail and analysis needed.
When to use a PERT chart vs. Gantt chart
When deciding between Gantt and PERT charts for project management, it’s crucial to understand their differences and identify which tool suits your project’s needs. Both charts offer visual representations, but they serve distinct purposes.
Gantt Charts
Gantt charts are utilized during project execution to schedule tasks, track progress, and communicate work completion. Each activity is represented by a bar that spans from the start to the end date. Gantt charts are suitable when you need to:
- Anticipate task completion time accurately.
- Clearly communicate task responsibility.
- Increase transparency regarding project progress.
PERT Charts
PERT charts are primarily used to plan and determine task durations before a project commences. They focus on task interdependencies and don’t display specific dates. PERT charts are preferable when you need to:
- Show the interdependencies between tasks.
- Estimate project completion time.
- Identify the critical path to meet deadlines.
- Plan for larger or more complex projects.
Both Gantt and PERT chart simplify project management processes and offer valuable insights into project progress. Consider using PERT charts for planning and visualizing task dependencies, while Gantt charts excel in tracking progress and scheduling tasks.
Leveraging both charts strategically can enhance organization and implementation of your project. Choosing the appropriate tool or utilizing both in conjunction allows you to manage projects effectively, increase efficiencies, and achieve successful outcomes.
Difference Between PERT and Gantt Chart: Use Case Comparison
Comparison Criteria | PERT Chart | Gantt Chart |
Project Scope |
|
|
Timeline |
|
|
Flexibility |
|
|
Task Assignment |
|
|
Visualization of the Big Picture |
|
|
 Recommended during the planning phase, allowing mapping of project tasks and dependencies.
 Challenging to change mid-project, making them less flexible.
The Benefits of Using the Gantt Chart View in OneThread
Gantt charts are invaluable for project planning, management, and presentations. Gantt charts enhance collaboration, improve communication, and ensure project success by providing a visual representation of tasks, timelines, and dependencies.
1. Effective Project Planning
Gantt charts comprehensively overview project timelines, tasks, and milestones. With clear visualizations, project managers can better understand the project scope, allocate resources efficiently, and identify potential bottlenecks. By enabling effective project planning, Gantt charts improve productivity and successful project execution.
2. Enhanced Project Presentations
The visual nature of Gantt charts makes them an excellent tool for project presentations. With the ability to display tasks as bars or rectangles with time codes, Gantt charts provide a clear and concise overview of project status.
This visual representation facilitates effective communication and enables stakeholders to easily comprehend the project’s progress, deadlines, and interdependencies.
3. Streamlined Team Collaboration
Gantt charts promote seamless collaboration within project teams. Team members can understand their roles and responsibilities by clearly illustrating task assignments and timelines.
This shared understanding fosters unity and enables team members to work together cohesively, avoiding misunderstandings and promoting a sense of shared ownership. Gantt charts act as a unifying force, ensuring that teams function as a cohesive unit.
4. Effective Project Management
Project managers can effectively leverage the Gantt chart tool to communicate project goals and expectations. By utilizing Gantt charts, managers provide clear direction to team members regarding project objectives and deadlines.
This clarity minimizes the risk of miscommunication and facilitates efficient workload distribution. Gantt charts empower project managers to identify potential risks early on, allowing for proactive mitigation and preventing future complications.
Creating a Gantt Chart in OneThread is a simple process
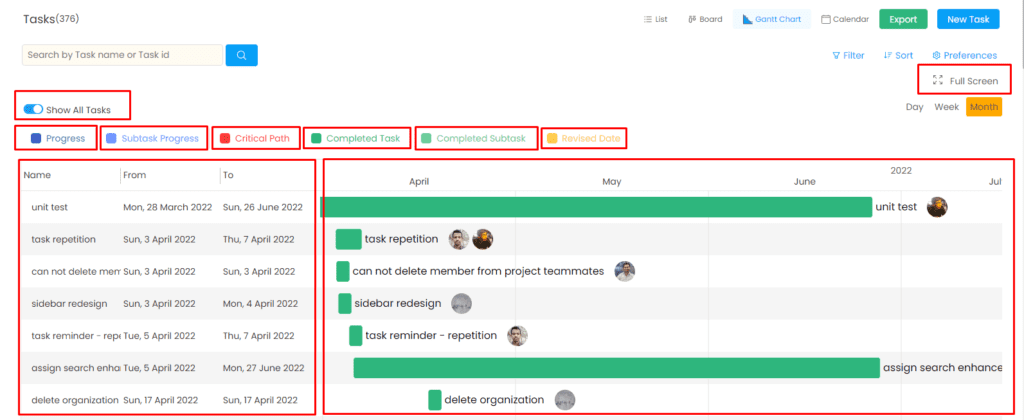
Step 01: Access your project dashboard and locate the ‘Gantt Chart’ button at the top of the page.
Step 02: Click on the ‘Gantt Chart’ button.
Step 03: Choose the project type.
Step 04: Determine the duration of your project, specifying the time it should take to complete in either days or hours.
Step 05: Provide a name for your project.
Step 06: Set the start date, end date, start time, and end time for your project.
Once you have completed these steps, you can easily plan and manage your projects using the Gantt Chart feature in OneThread. This tool will help you stay organized and meet your project deadlines effectively. Start using Gantt Charts in OneThread for free!
Conclusion
So, now you know the difference between PERT and Gantt chart. While both are used in project management, they have distinct characteristics that make them suitable for specific situations.
PERT charts are best suited for complex projects that require a lot of interdependent activities and where time is of utmost importance. On the other hand, Gantt charts are ideal when you need to visualize timelines for simpler projects that have fewer dependencies.
Ultimately, whether you choose to use a PERT chart or a Gantt chart will depend on the specific needs of your project. Both tools have their advantages and disadvantages, so it’s important to weigh these carefully before making a decision.
With this knowledge at hand, you’ll be better equipped to plan and manage your next project effectively.
Frequently Asked Questions
Can PERT And Gantt Charts Be Used Together In Project Management?
You can combine PERT and Gantt charts in project management to gain benefits like improved visibility and better planning. However, implementing them in Agile projects may pose challenges due to their differing approaches to project scheduling.
What Are Some Common Mistakes To Avoid When Creating PERT Or Gantt Charts?
When creating PERT or Gantt charts, common mistakes include not breaking down tasks enough and underestimating time. Best practices include involving stakeholders and updating the chart regularly to ensure accuracy.
How Do PERT And Gantt Charts Differ From Other Project Management Tools?
The difference between PERT and gantt chart lies in their unique features. PERT emphasizes critical path analysis while Gantt focuses on scheduling. Real world examples of implementation include construction projects using Gantt and research analyses utilizing PERT.